
Intraday Trading Free Course – Beginner to PRO Guide
Intraday trading free course focused on market basics and safe trading concepts.
📘 Index
- Chapter 1: Introduction to Intraday Trading
- Chapter 2: Market Sessions & Best Time to Trade Intraday
- Chapter 3: How to Pick the Right Stocks for Intraday Trading
- Chapter 4: Candlestick Patterns for Beginners That Actually Work
- Chapter 5: Top 10 Intraday Strategies that Work in Any Market
- Chapter 6: Top 2 Bonus Professional Trading Setups
- Chapter 7: Mastering Risk Management in Intraday Trading
- Chapter 8: Psychology of a Successful Intraday Trader
- Chapter 9: The Power of Discipline in Intraday Trading
- Chapter 10: Building A Winning Intraday Trading Routine
- Chapter 11: Building Your Own Intraday Trading Setup
- Chapter 12: Order Types & Execution in Intraday Trading
- Chapter 13: Market Microstructure & Liquidity in Intraday
- Chapter 14: Common Mistakes in Intraday Trading & How to Avoid Them
- Chapter 15: Your Roadmap to Consistent Profit
Chapter 1: Introduction to Intraday Trading
Intraday trading, also known as day trading, is one of the most dynamic and fast-paced ways to participate in the stock market. Unlike long-term investing—where stocks are held for months or even years—intraday trading focuses on buying and selling stocks within the same trading day.
The core objective is simple:
👉 Capture small price movements and turn them into consistent, repeatable profits.
While the concept may sound straightforward, successful intraday trading requires precision, discipline, and a well-defined system.
Why Choose Intraday Trading?
Intraday trading has gained massive popularity because of the unique advantages it offers:
1. Quick Results (No Overnight Risk)
All positions are closed before the market ends (around 3:30 PM in India). This means you are not exposed to overnight news, global events, or sudden price gaps.
2. Daily Opportunities
Every trading day presents new setups and fresh opportunities. Unlike investing, you don’t have to wait months to see results.
3. Leverage Benefits
Most brokers provide margin (leverage), allowing you to take larger positions with relatively smaller capital. This increases both profit potential and risk.
4. Faster Learning Curve
Because trades happen frequently, beginners gain experience quickly. You learn from real market situations every single day.
The Reality Check
From the outside, intraday trading looks easy and exciting—but the reality is very different.
- Nearly 80% of beginners lose money due to lack of strategy and discipline
- Emotional decisions driven by fear, greed, and overconfidence lead to consistent losses
- Blindly following tips or signals rarely works
👉 The truth is:
Success in intraday trading does not come from luck or tips—it comes from mastering setups, risk management, and psychology.
This guide is designed to help you build that foundation step by step.
What Makes Intraday Trading Different?
Intraday trading is completely different from long-term investing in both mindset and approach.
Time Frame
All trades are executed and closed within the same day.
Focus
More emphasis on:
- Charts
- Price action
- Technical indicators
Approach
- Quick decision-making
- Strict discipline
- Clear trade planning
👉 While investing is about long-term wealth creation, intraday trading is about short-term precision and daily income generation.
Basic Requirements for Intraday Trading
Before you start, you need a few essential things:
- Trading & Demat Account
Opened with a reliable broker. - Stable Internet Connection
Fast execution is critical in intraday trading. - Starting Capital
Beginners can start with ₹10,000–₹50,000 and gradually scale up. - Trading Platform
Platforms like Zerodha Kite, Upstox, Angel One, or ICICI Direct are commonly used in India. - Trading Journal
Recording your trades helps you identify mistakes and improve consistently.
👥 Who Is This Guide For?
This guide is designed for:
- Beginners who want to build a strong foundation in trading
- Working professionals looking for structured intraday setups without spending the entire day
- Struggling traders who have faced losses and now want a clear, proven roadmap
📚 What You Will Learn
By the end of this guide, you will understand:
- How to read candlestick patterns and market psychology
- Proven intraday strategies that work in real market conditions
- Professional trading setups used by experienced traders
- Risk management techniques to protect your capital
- Discipline and mindset required for consistent profitability
Final Note
Intraday trading is not gambling—but it can feel like it if you approach it without knowledge or discipline.
It is a skill-based profession where success depends on:
- The right strategy
- Strong risk management
- Emotional control
With proper learning, consistent practice, and disciplined execution, intraday trading can become a reliable source of income over time.
👉 By the end of this guide, you won’t just learn how to trade—you’ll learn how to think and act like a professional trader.
Chapter 2: Market Sessions & Best Time to Trade Intraday
One of the most common questions every beginner asks is:
👉 “What is the best time to trade intraday?”
The answer is not just a single time — it’s about understanding how the market behaves at different times of the day.
The stock market moves in phases. Each phase has its own behavior, volatility, and opportunity.
👉 If you understand these sessions, you can trade at the right time and avoid unnecessary losses.
1. Pre-Market Session
(9:00 AM – 9:15 AM)
This is the preparation phase before the market officially opens.
What happens here?
- Orders are collected but not executed immediately
- Prices are adjusted based on overnight news and global cues
For Beginners:
- High uncertainty
- No clear direction
👉 Avoid trading in this session
✅ What you should do:
- Prepare your watchlist
- Mark support & resistance levels
- Check global market trends
👉 Pro Tip:
Don’t rush. The best traders spend this time preparing, not trading.
2. Opening Session (9:15 – 9:45 AM)
This is the most volatile phase of the market.
What happens here?
- Strong price movements
- Institutional orders hit the market
- Reaction to overnight news
Risk:
- False breakouts are very common
- Price moves can be unpredictable
Who should trade?
- Experienced traders only
Beginner Mistake:
Entering trade exactly at 9:15 AM
👉 Better Approach:
Wait at least 15 minutes for the market to settle.
3. Morning Session (9:45 AM – 11:30 AM) — BEST TIME
This is the golden window for intraday trading.
✅ Why this session is best:
- Trend becomes clear
- Volatility is still strong
- Market direction is more reliable
👉 Most professional traders take their entries during this time.
Example Setup:
- Nifty is bullish
- A stock like Reliance breaks resistance at 10:15 AM with strong volume
👉 This becomes a high-probability trade
Why beginners should focus here:
- Less noise compared to opening
- Clear setups
- Better accuracy
4. Midday Session
(11:30 AM to 1:30 PM)
This is the slowest phase of the market.
What happens here?
- Low volatility
- Reduced liquidity
- Sideways (range-bound) movement
Problem:
- Trades get stuck
- Small moves → low profit
- False signals increase
❌ What beginners do:
- Overtrade due to boredom
✅ What you should do:
- Avoid trading
- Review your past trades
- Analyze mistakes
👉 Pro Tip:
Sometimes, the best trade is no trade
5. Closing Session (1:30 – 3:30 PM)
This is the second opportunity window of the day.
What happens here?
- Volume increases again
- Institutions close positions
- Strong momentum builds
Best Time:
👉 2:30 PM – 3:15 PM
Example:
- A stock holds above VWAP all day
- Breakout happens in the last hour
👉 This creates a powerful momentum trade
Best Time for Beginners
If you want consistency, focus only on these two windows:
🟢 1. Morning Session:
👉 9:45 AM – 11:30 AM
- Clear trends
- Good liquidity
- High accuracy setups
🟢 2. Closing Momentum:
👉 2:30 PM – 3:15 PM
- Strong moves
- Breakout opportunities
Key Takeaways
- ❌ Don’t rush into trades at 9:15 AM
- ✅ Focus on 9:45 AM – 11:30 AM
- ⚠️ Avoid midday overtrading
- ✅ Trade afternoon only with strong confirmation
Final Insight
Intraday trading is not about trading all day.
👉 It’s about trading at the right time.
Professional traders don’t sit in the market for hours —
they wait patiently and strike only when conditions are favorable.
👉 Right timing + Right setup = Consistent profit
Chapter 3: How to Pick the Right Stocks for Intraday Trading
One of the most important skills in intraday trading is stock selection.
Even the best strategy will fail if you choose the wrong stock.
👉 Think of it like this:
A perfect setup on a bad stock = loss
An average setup on a good stock = higher chance of profit
That’s why professional traders spend more time selecting stocks than actually trading.
Why Stock Selection Matters
Intraday trading depends on:
- Price movement
- Liquidity
- Clear direction
If a stock:
- Doesn’t move
- Has low volume
- Is moving randomly
👉 Then no strategy will work consistently.
Key Criteria for Selecting Intraday Stocks
1. Liquidity (High Volume Stocks)
Liquidity means how easily you can enter and exit a trade without delay or slippage.
✅ Why it matters:
- Faster execution
- Tight bid-ask spread
- Smooth price movement
❌ Problems with low liquidity:
- Wide spread
- Slippage losses
- Difficulty exiting trades
Examples of High Liquidity Stocks:
- Reliance
- HDFC Bank
- TCS
- Infosys
✅ Rule:
👉 Always choose stocks with at least 10–15 lakh daily traded volume
2. Volatility (Price Movement)
Intraday trading is all about capturing price movement.
❌ Avoid:
- Stocks that move only ₹1–₹2 in a full day
👉 No movement = No profit opportunity
✅ What to look for:
- Stocks that move at least 2–3% daily
Examples:
- Tata Motors
- Adani Ports
👉 These stocks frequently give strong intraday swings.
3. Correlation with Index
Some stocks move in line with the overall market index.
✅ Why this matters:
- Easier to predict direction
- Higher probability trades
Example:
- HDFC Bank & ICICI Bank move with BankNifty
- IT stocks follow Nifty trend
✅ Rule:
👉 If Nifty is bullish → focus on BUY trades
👉 If Nifty is bearish → focus on SELL trades
4. News & Event-Based Stocks
News can trigger strong and fast price movements.
Common triggers:
- Company earnings
- Government policies
- Global news
- Sector updates
Example:
- Pharma stocks after drug approval
- IT stocks after US market news
Rule:
👉 Trade news-based stocks only with strict stop loss
5. Price Range & Affordability
❌ Avoid:
- Extremely high-priced stocks (like MRF ₹1 lakh+)
👉 High risk for beginners
✅ Ideal Range:
👉 ₹200 – ₹3000 stocks
Why this works:
- Better position sizing
- Controlled risk
- Easier capital management
Avoid Penny & Illiquid Stocks (Biggest Beginner Mistake)
Penny stocks may look attractive because of their low price…
👉 But they are highly risky and often manipulated
Problems:
- Very low volume
- Price manipulation
- No proper trend
- Difficult to exit trades
Golden Rule:
👉 Never trade penny stocks in intraday
Good vs Bad Stock Selection
✅ Good Stock Example: Tata Motors
- High liquidity
- Moves 2–3% daily
- Clear trend on 15-minute chart
❌ Bad Stock Example: Small-cap ₹8 stock
- Very low volume
- Moves only a few paisa
- Wide spread
- No clear direction
Pro Tips for Beginners
- Maintain a watchlist of 10–15 strong stocks
- Trade the same stocks daily to understand behavior
- Check NSE Top Gainers/Losers list daily
- Focus on quality stocks, not quantity of trades
Final Insight
Stock selection is half the game in intraday trading.
If you choose the right stock, your strategy becomes much more effective.
Professional traders don’t trade randomly —
👉 They trade only the best setups on the best stocks.
Chapter 4: Candlestick Patterns for Beginners That Actually Work
Candlestick patterns are the foundation of all trading strategies.
If you learn how to read candles properly, you can understand what the market is doing — without relying too much on indicators.
👉 Every candle tells a story:
Who is in control — buyers or sellers?
1. Why Candlesticks Matter
Candlestick charts are widely used by professional traders because they show:
- Price movement (price action)
- Market psychology (buyer vs seller battle)
Unlike indicators (which are delayed), candlesticks give real-time signals.
👉 In intraday trading, speed matters — and candlesticks help you act faster.
2. Structure of a Candlestick
Every candlestick has 4 important components:
- Open → Price at the start
- High → Highest price
- Low → Lowest price
- Close → Price at the end
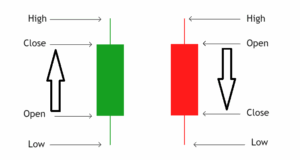
Candle Parts:
- Body → Difference between Open & Close
- Wick (Shadow) → Shows rejection (high/low levels)
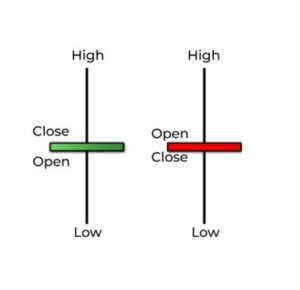
Color Meaning:
- 🟢 Green Candle → Close > Open (Buyers in control)
- 🔴 Red Candle → Close < Open (Sellers in control)
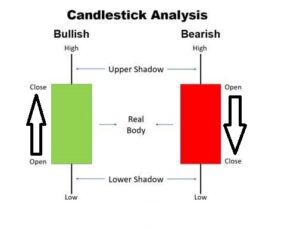
3. Types of Candlesticks
🟢 Bullish Candle
- Price closes higher than open
- Indicates buying pressure
🔴 Bearish Candle
- Price closes lower than open
- Indicates selling pressure
Doji (Indecision Candle)
- Open ≈ Close
- Market is confused (buyers vs sellers equal)
👉 Looks like a cross
👉 Best used near support/resistance
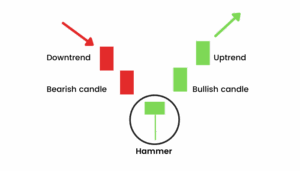
4. Important Single Candlestick Patterns
Hammer (Bullish Reversal)
- Small body at top
- Long lower wick
- Appears after downtrend
👉 Meaning: Buyers are stepping in
Trade Setup:
- Buy above candle high
- Stop Loss below wick
Shooting Star (Bearish Reversal)
- Small body at bottom
- Long upper wick
- Appears after uptrend
👉 Meaning: Sellers rejecting higher price
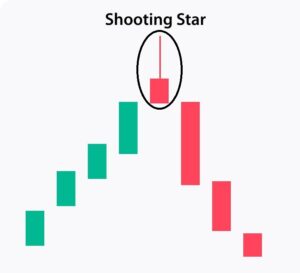
Trade Setup:
- Sell below candle low
- Stop Loss above wick
Doji
- Market indecision
- No clear direction
👉 Best Strategy:
Wait for breakout confirmation before trading
Marubozu (Strong Trend Candle)
- Full body, no wick
👉 Meaning:
- Strong buyers (green)
- Strong sellers (red)
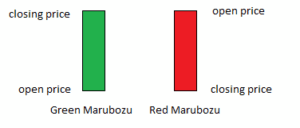
Trade Setup:
- Enter in candle direction
- Keep small stop loss
5. Important Double Candlestick Patterns
🟢 Bullish Engulfing
- Small red candle
- Followed by big green candle
👉 Meaning: Buyers take control
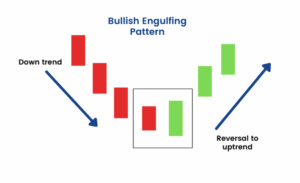
Trade:
- Buy above green candle
🔴 Bearish Engulfing
- Small green candle
- Followed by big red candle
👉 Meaning: Sellers take control
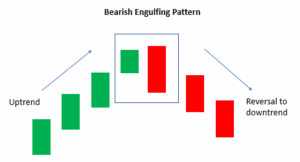
Trade:
- Sell below red candle
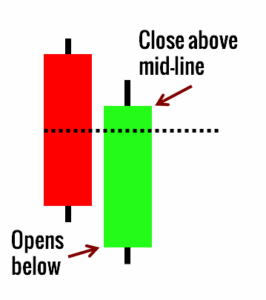
Piercing Pattern (Bullish)
- After downtrend
- Green candle closes above midpoint of red
👉 Signal: Buying strength
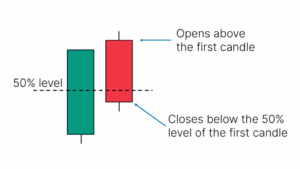
Dark Cloud Cover (Bearish)
- After uptrend
- Red candle closes below midpoint of green
👉 Signal: Selling pressure
6. Important Triple Candlestick Patterns
Morning Star (Bullish Reversal)
- Red → Small/Doji → Big Green
- Appears at bottom
👉 Meaning: Trend reversal to upside
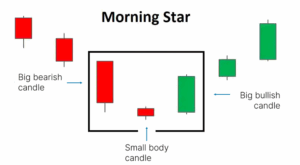
Trade:
- Buy above green candle
- SL below Doji
Evening Star (Bearish Reversal)
- Green → Small/Doji → Big Red
- Appears at top
👉 Meaning: Trend reversal to downside
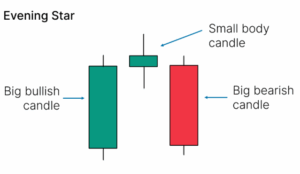
Trade:
- Sell below red candle
- SL above Doji
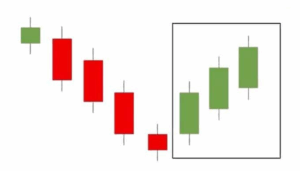
🟢 Three White Soldiers
- 3 strong green candles
👉 Indicates strong uptrend
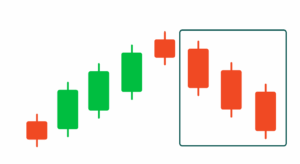
🔴 Three Black Crows
- 3 strong red candles
👉 Indicates strong downtrend
7. How to Use Candlestick Patterns in Intraday
To make candlestick patterns work effectively, follow these rules:
✅ 1. Use 15-Min Time Frame
- More reliable than lower timeframes
✅ 2. Confirm with Volume
- Breakout + volume = strong signal
✅ 3. Combine with Levels
- Use support/resistance or VWAP
✅ 4. Never Trade a Single Candle
- Always wait for confirmation
✅ 5. Maintain Risk-Reward
👉 Minimum 1:2 ratio
Key Takeaway
Candlestick patterns are the ABC of trading.
They teach you how the market behaves and how traders think.
👉 A trader who understands candlesticks can:
- Read charts easily
- Identify opportunities faster
- Avoid bad trades
Final Truth:
Candles are signals, not guarantees.
👉 Always combine them with:
- Volume
- Support/Resistance
- Proper risk management
Chapter 5: Top 10 Intraday Strategies that Work in Any Market
In this chapter, you’ll learn powerful intraday trading strategies that are simple, practical, and used by professional traders.
👉 All strategies in this guide are designed for the 15-minute timeframe, which offers:
- Better accuracy
- Less noise
- Clearer trends
Each strategy follows a structured approach:
👉 Concept → Setup → Entry → Stop Loss → Target → Pro Tips
Strategy 1: EMA Crossover (Trend-Following Strategy)
This is one of the most beginner-friendly and reliable intraday strategies.
Concept
This strategy uses two Exponential Moving Averages (EMA):
- 9 EMA → Short-term momentum
- 21 EMA → Overall intraday trend
👉 When these two lines cross, it signals a potential trend change.
Why This Strategy Works
- EMAs smooth out price and reduce noise
- Crossovers help identify trend early
- Widely used by professional traders
- Works best on liquid and trending stocks
Strategy Setup (15-Min Chart)
- Open a 15-minute chart
- Apply:
- 9 EMA
- 21 EMA
- Wait for crossover
- Confirm with:
- Volume
- Overall market trend (Nifty direction)
🟢 Buy Setup (Bullish Crossover)
- 9 above 21 EMA
- Indicates trend turning bullish
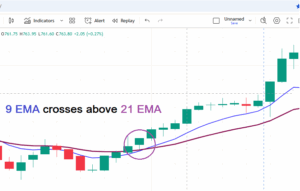
Entry:
👉 Buy at candle close after crossover
Stop Loss:
👉 Below recent swing low
Target:
👉 Next resistance OR
👉 Maintain 1:2 risk-reward ratio
🔴 Sell Setup (Bearish Crossover)
- 9 EMA crosses below 21 EMA
- Indicates trend turning bearish
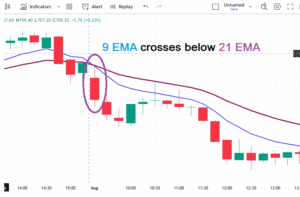
Entry:
👉 Sell at candle close after crossover
Stop Loss:
👉 Above recent swing high
Target:
👉 Next support OR
👉 Maintain 1:2 risk-reward ratio
Example Trade
Stock: HDFC Bank
- 9 EMA crosses above 21 EMA at ₹1600
- Entry = ₹1602
- Stop Loss = ₹1590 (₹12 risk)
- Target = ₹1626 (₹24 reward)
👉 This maintains a perfect 1:2 risk-reward ratio
Pro Tips for Better Accuracy
- Works best in trending markets
- Avoid in sideways markets
- Always wait for candle close
- Combine with RSI:
- Above 50 → Buy confirmation
- Below 50 → Sell confirmation
- If both EMAs are flat → skip the trade
Final Insight
The 9 EMA & 21 EMA crossover strategy is:
- Simple to understand
- Easy to apply
- Highly effective for beginners
👉 It helps you catch trends early and avoid random trades.
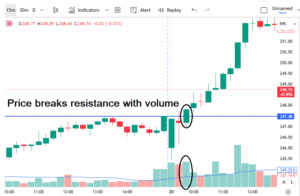
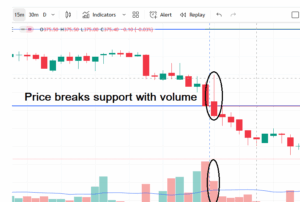
Strategy 2: Support & Resistance Breakout Strategy
The Support & Resistance Breakout Strategy is one of the most powerful and widely used setups in intraday trading. It is simple, logical, and highly effective when used correctly.
Concept
- Support = Price level where buyers step in (acts like a floor)
- Resistance = Price level where sellers step in (acts like a ceiling)
👉 When price breaks these levels with strong momentum, it often leads to big intraday moves.
Why Breakout Strategy Works
- Support and resistance levels are closely watched by institutions and professional traders
- When price breaks these zones, new orders enter the market
- This creates strong momentum and often starts a new trend
👉 In simple words:
Breakout = Entry of smart money + strong movement
Strategy Setup (15-Min Chart)
- Open a 15-minute chart
- Mark:
- Support levels (recent swing lows)
- Resistance levels (recent swing highs)
- Wait for price to reach these levels
- Trade only when breakout happens with strong volume
🟢 Buy Setup (Resistance Breakout)
- Price breaks and closes above resistance
- Resistance = recent swing high
Entry:
👉 Buy at breakout candle close
Stop Loss:
👉 Below breakout level
Target:
👉 Next resistance OR
👉 Maintain 1:2 risk-reward ratio
🔴 Sell Setup (Support Breakout)
- Price breaks and closes below support
- Support = recent swing low
Entry:
👉 Sell at breakout candle close
Stop Loss:
👉 Above breakout level
Target:
👉 Next support OR
👉 Maintain 1:2 risk-reward ratio
Example Trade
Stock: Adani Ports
- Resistance level = ₹1370
- Price breaks above ₹1370 with strong volume
Trade Plan:
- Entry = Above ₹1370
- Stop Loss = ₹1355
- Target = ₹1400
👉 Clear breakout + volume = high probability trade
Pro Tips for Breakout Trading
- Always trade breakouts with strong volume
- Avoid entering before breakout confirmation
- Wait for 15-minute candle close (avoid fake breakouts)
- If price retests breakout level and holds → re-entry opportunity
- Combine with indicators like:
- RSI
- MACD
Common Mistake
👉 Entering trade before breakout
👉 Result = Fake breakout trap
Always remember:
Confirmation first, entry later
Final Insight
The Support & Resistance Breakout Strategy is:
- Simple to understand
- Easy to apply
- Highly reliable
👉 It works for both beginners and professional traders because it follows basic market logic.
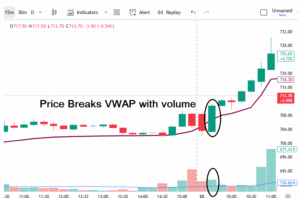
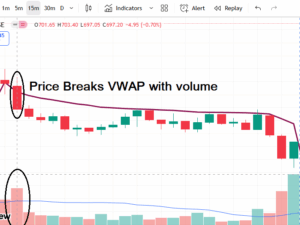
Strategy 3: VWAP Trading Strategy Advanced Setup
The VWAP (Volume Weighted Average Price) is one of the most powerful tools used in intraday trading. It is not just an indicator — it is a benchmark level used by institutions.
👉 VWAP shows the average price of a stock based on both price and volume.
Because large institutions track VWAP, it becomes a highly reliable intraday level.
Concept
VWAP acts like a dynamic support and resistance line.
- Price above VWAP → Bullish bias
- Price below VWAP → Bearish bias
👉 In simple terms:
Above VWAP = Buyers in control
Below VWAP = Sellers in control
Why VWAP + Volume Works
- A 15-minute candle close above/below VWAP confirms direction
- High volume indicates institutional participation
- Filters out weak and false signals
👉 This makes VWAP one of the most accurate intraday strategies.
Strategy Setup (15-Min Chart)
- Open a 15-minute chart
- Add the VWAP indicator
- Focus only on:
- Candle closing above or below VWAP
- Confirm with:
- Higher-than-average volume
- Trade in the direction of breakout
🟢 Buy Setup (Above VWAP)
- A 15-min candle closes above VWAP
- Volume is higher than the previous 2–3 candles
Entry:
👉 Buy at candle close
Stop Loss:
👉 Below VWAP
Target:
👉 Next resistance OR
👉 Maintain 1:2 risk-reward ratio
🔴 Sell Setup (Below VWAP)
- A 15-min candle closes below VWAP
- Volume is higher than the previous 2–3 candles
Entry:
👉 Sell at candle close
Stop Loss:
👉 Above VWAP
Target:
👉 Next support OR
👉 Maintain 1:2 risk-reward ratio
Example Trade
Stock: Reliance
- VWAP level = ₹2450
- At 10:15 AM, candle closes at ₹2455 (above VWAP) with strong volume
Trade Plan:
- Entry = ₹2455
- Stop Loss = ₹2445 (₹10 risk)
- Target = ₹2475 (₹20 reward)
👉 Perfect 1:2 risk-reward trade
Pro Tips for VWAP Strategy
- Avoid trades when candle closes near VWAP with low volume
- VWAP resets every day → valid only for intraday
- Combine with:
- Support & Resistance
- Market trend
- Works best in:
- F&O stocks
- Indices like Nifty & Bank Nifty
Common Mistake
👉 Trading every touch of VWAP
VWAP is not for random entries —
👉 Wait for clear breakout + volume confirmation
Final Insight
The VWAP strategy is:
- Rule-based
- Simple to follow
- Highly effective
👉 It helps you trade in the direction of smart money (institutions) and avoid overtrading.
Strategy 4: RSI Trading Strategy That Works
The RSI (Relative Strength Index) is one of the most popular and easy-to-use indicators in intraday trading. It helps traders understand market strength, momentum, and potential reversal points.
👉 In simple terms:
RSI tells you whether a stock is overbought (too expensive) or oversold (too cheap).
Concept
RSI measures the speed and strength of price movement on a scale from 0 to 100.
Key Levels:
- Above 70 → Overbought (price may fall)
- Below 30 → Oversold (price may rise)
- 40–60 zone → Neutral (sideways market)
👉 Important Understanding:
- RSI doesn’t predict exact reversal
- It gives a probability signal
Why RSI Works
- Helps identify reversal points
- Confirms trend strength
- Filters out weak trades
👉 Especially useful for intraday traders looking for short-term opportunities
Strategy Setup (15-Min Chart)
- Open a 15-minute chart
- Apply RSI (14-period)
- Focus on:
- Overbought & oversold zones
- Wait for confirmation signal before entering
🟢 Buy Setup (Oversold Reversal)
- RSI falls below 30 (oversold)
- RSI then crosses back above 30
👉 This signals potential upward reversal
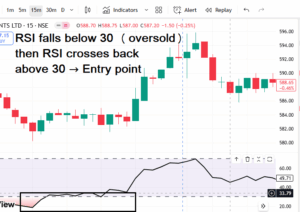
Entry:
👉 Buy when RSI crosses above 30
Stop Loss:
👉 Below recent swing low
Target:
👉 Maintain 1:2 risk-reward ratio
🔴 Sell Setup (Overbought Reversal)
- RSI goes above 70 (overbought)
- RSI then crosses back below 70
👉 This signals potential downward reversal
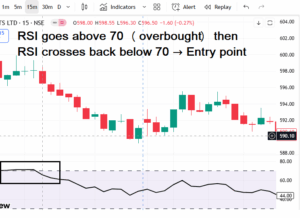
Entry:
👉 Sell when RSI crosses below 70
Stop Loss:
👉 Above recent swing high
Target:
👉 Maintain 1:2 risk-reward ratio
Example Trade
Stock: Tata Motors
- RSI drops to 28 → oversold
- RSI reverses and crosses above 30
Trade Plan:
- Entry = ₹700
- Stop Loss = ₹695 (₹5 risk)
- Target = ₹710 (₹10 reward)
👉 Perfect 1:2 risk-reward setup
Pro Tips for RSI Strategy
- ❌ Don’t use RSI alone
👉 Always combine with:- Support & Resistance
- Trend lines
- In strong uptrend:
👉 RSI can stay above 70 for long
👉 Avoid shorting blindly
- In strong downtrend:
👉 RSI can stay below 30
👉 Avoid aggressive buying
Common Mistake
👉 Treating RSI as a direct buy/sell signal
RSI is a confirmation tool, not a standalone strategy.
Final Insight
RSI is:
- Simple
- Powerful
- Beginner-friendly
👉 It helps you identify:
- Reversal opportunities
- Market momentum
But real success comes when you combine RSI with:
👉 Price action + Levels + Discipline
Strategy 5: MACD Trading Strategy for Beginners
The MACD (Moving Average Convergence Divergence) is one of the most powerful indicators for intraday trading. It helps you understand three important things:
👉 Trend direction
👉 Momentum strength
👉 Potential reversals
Concept
MACD is a momentum + trend-following indicator that shows how fast price is moving and in which direction.
It is especially useful for:
- Identifying trend continuation
- Catching early reversals
- Confirming breakout strength
How MACD Works
MACD has 3 main components:
1. MACD Line
👉 Difference between 12 EMA and 26 EMA
→ Shows short-term vs long-term momentum
2. Signal Line
👉 9 EMA of MACD Line
→ Used for crossover signals
3. Histogram
👉 Difference between MACD Line & Signal Line
- Above zero → Bullish strength
- Below zero → Bearish strength
👉 Key Idea:
When MACD Line crosses Signal Line → Trading signal generated
Strategy Setup (15-Min Chart)
- Open a 15-minute chart
- Apply MACD (12, 26, 9)
- Focus on:
- Crossovers
- Histogram direction
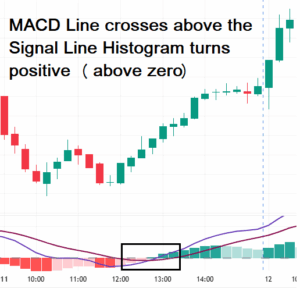
🟢 Buy Setup (Bullish Crossover)
- MACD Line crosses above Signal Line
- Histogram turns positive (above zero)
👉 Indicates bullish momentum
Entry:
👉 Buy at crossover confirmation
Stop Loss:
👉 Below recent swing low
Target:
👉 Maintain 1:2 risk-reward ratio
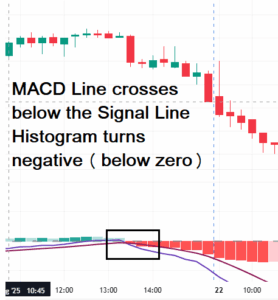
🔴 Sell Setup (Bearish Crossover)
- MACD Line crosses below Signal Line
- Histogram turns negative (below zero)
👉 Indicates bearish momentum
Entry:
👉 Sell at crossover confirmation
Stop Loss:
👉 Above recent swing high
Target:
👉 Maintain 1:2 risk-reward ratio
Example Trade
Stock: Infosys
- MACD Line crosses above Signal Line at ₹1400
- Histogram turns positive
Trade Plan:
- Entry = ₹1400
- Stop Loss = ₹1390 (₹10 risk)
- Target = ₹1420 (₹20 reward)
👉 Perfect 1:2 risk-reward trade
Pro Tips for MACD Strategy
- ✅ Works best when aligned with overall trend
- ❌ Avoid trading when:
- MACD lines are flat
- Histogram is near zero
👉 Indicates sideways market
- Combine with:
- Support & Resistance
- Breakout setups
- Best used in:
- Trending markets
- High momentum stocks
Common Mistake
👉 Taking every crossover blindly
Not all crossovers are strong —
👉 Always confirm with trend and momentum
Final Insight
MACD is a powerful indicator because it combines:
- Trend
- Momentum
- Timing
👉 It helps you enter trades with better confidence and avoid weak setups.
Strategy 6: Bollinger Bands (Bounce Strategy)
Bollinger Bands are one of the simplest yet most powerful tools for intraday trading. They help you understand:
👉 Volatility (market speed)
👉 Overbought / Oversold conditions
👉 Breakout opportunities
This strategy works in both reversal markets (bounce) and trending markets (breakout).
Concept
Bollinger Bands consist of 3 lines:
- Middle Band → 20-period Simple Moving Average (SMA)
- Upper Band → Resistance level (SMA + 2 standard deviations)
- Lower Band → Support level (SMA – 2 standard deviations)
👉 Basic idea:
- Price usually moves between the bands
- When price touches extremes → possible reversal
- When price breaks outside → possible strong trend
Strategy Setup (15-Min Chart)
- Open a 15-minute chart
- Apply Bollinger Bands (20, 2)
- Focus on:
- Band touch (reversal)
- Band breakout (trend)
🟢 Buy Signal (Oversold Reversal)
- Price touches or closes below lower band
- (Optional) RSI below 30 confirms oversold
👉 Indicates price may reverse upward
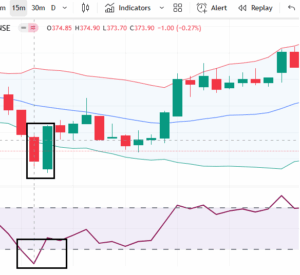
Entry:
👉 Buy when price moves back inside the band
Stop Loss:
👉 Below recent swing low
Target:
👉 Middle band OR
👉 Maintain 1:2 risk-reward ratio
🔴 Sell Signal (Overbought Reversal)
- Price touches or closes above upper band
- (Optional) RSI above 70 confirms overbought
👉 Indicates price may reverse downward
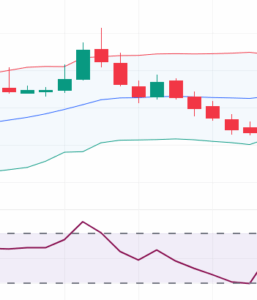
Entry:
👉 Sell when price moves back inside the band
Stop Loss:
👉 Above recent swing high
Target:
👉 Middle band OR
👉 Maintain 1:2 risk-reward ratio
Strategy 7 :Bollinger Bands (Breakout Strategy)
When to Trade Breakout?
- Bands become very tight (called squeeze)
👉 Indicates low volatility
👉 After squeeze → big move expected
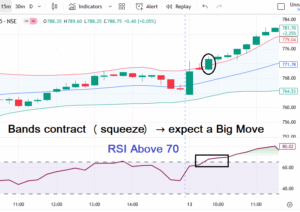
🟢 Buy Breakout
- Strong candle closes above upper band
Entry:
👉 Buy in breakout direction
Stop Loss:
👉 Near middle band
Target:
👉 Maintain 1:2 risk-reward ratio
🔴 Sell Breakout
- Strong candle closes below lower band
Entry:
👉 Sell in breakout direction
Stop Loss:
👉 Near middle band
Target:
👉 Maintain 1:2 risk-reward ratio
👉 Important:
- In strong trends:
- RSI may stay above 70 (uptrend)
- RSI may stay below 30 (downtrend)
Example Trade
Stock: Reliance
- Price breaks above upper band at ₹2420
- RSI near 70 (strong momentum)
Trade Plan:
- Entry = ₹2425
- Stop Loss = ₹2410 (₹15 risk)
- Target = ₹2455 (₹30 reward)
👉 Perfect 1:2 risk-reward setup
Pro Tips for Bollinger Bands
- ✅ Combine with:
- RSI (for reversal confirmation)
- MACD (for momentum confirmation)
- ❌ Avoid trading when:
- Bands are too wide
👉 Market already moved
- Bands are too wide
- 🔥 Focus on:
- Band squeeze → breakout opportunity
- ⚠️ Always trade:
- Liquid stocks
👉 Avoid false signals
- Liquid stocks
Common Mistake
👉 Blindly trading every band touch
Not every touch = reversal
👉 Always wait for confirmation
Final Insight
Bollinger Bands give you two powerful advantages:
✔ Reversal trading (bounce)
✔ Breakout trading (trend)
👉 That makes it one of the most versatile intraday tools.
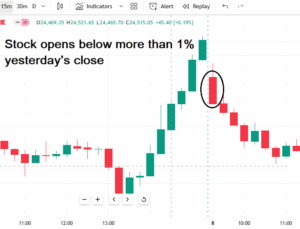
Strategy 8: Gap-Up & Gap-Down Trading Strategy
Gap trading is one of the most powerful intraday strategies because it captures strong moves right at market open.
👉 A gap occurs when a stock opens significantly higher or lower than its previous day’s closing price.
These gaps usually happen due to:
- News
- Earnings results
- Global market movement
👉 And they often lead to high momentum trades.
Concept
📈 Gap-Up
- Stock opens above previous day’s close
- Indicates strong buying interest
📉 Gap-Down
- Stock opens below previous day’s close
- Indicates strong selling pressure
👉 Important:
Not every gap is tradable — you need confirmation
Strategy Setup (15-Min Chart)
- Identify stocks with:
- Gap-Up or Gap-Down (1% or more)
- Open 15-minute chart
- Wait for the first 15-minute candle to close
- Trade based on breakout of that candle
🟢 Gap-Up Trading (Bullish Setup)
- Stock opens 1% or more above yesterday’s close
- First 15-min candle is bullish
👉 Confirmation:
- Price breaks above high of first candle
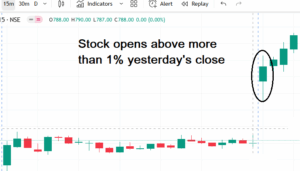
Entry:
👉 Buy above first candle high
Stop Loss:
👉 Low of first 15-min candle
Target:
👉 Next resistance OR
👉 Maintain 1:2 risk-reward ratio
🔴 Gap-Down Trading (Bearish Setup)
- Stock opens 1% or more below yesterday’s close
- First 15-min candle is bearish
👉 Confirmation:
- Price breaks below low of first candle
Entry:
👉 Sell below first candle low
Stop Loss:
👉 High of first 15-min candle
Target:
👉 Next support OR
👉 Maintain 1:2 risk-reward ratio
Example Trade
Stock: HDFC Bank
- Previous close = ₹1600
- Opening price = ₹1630 (Gap-Up)
First 15-min candle:
- High = ₹1635
- Low = ₹1620
Trade Plan:
- Entry = Above ₹1635
- Stop Loss = ₹1620 (₹15 risk)
- Target = ₹1665 (₹30 reward)
👉 Clean 1:2 risk-reward trade
Pro Tips for Gap Trading
- ✅ Trade only in:
- High volume (liquid) stocks
- F&O stocks preferred
- Always check:
- News
- Earnings
👉 These are main reasons for gaps
- ⚠️ Avoid trade if:
- Gap fills quickly (price comes back to previous close)
- Best trades happen when:
👉 Gap direction matches overall market trend (Nifty / BankNifty)
Common Mistake
👉 Entering trade immediately after market open
This leads to:
- Fake moves
- Stop loss hits
👉 Always wait for first 15-min candle confirmation
Final Insight
Gap trading gives you:
- Early entry
- Strong momentum
- High reward potential
But only if you follow rules and wait for confirmation.
👉 Patience at open = Profit in trade
Strategy 9: Pullback Trading Strategy (Trend Continuation)
The Pullback Strategy is one of the safest and most professional ways to trade in intraday.
Instead of chasing price, you wait for the market to come back to you.
👉 A pullback is a temporary pause or correction in a trending market.
Concept
Markets don’t move in a straight line. They move in waves:
👉 Impulse → Pullback → Impulse
- Impulse = strong move in trend direction
- Pullback = temporary correction
👉 Smart traders enter during pullbacks, not during breakouts.
Why Pullback Trading Works
- Trends move in structured waves
- Pullbacks offer better entry price
- Lower risk compared to chasing breakouts
- Higher probability when trend is strong
👉 In simple terms:
Buy low in uptrend, Sell high in downtrend
Strategy Setup (15-Min Chart)
- Open a 15-minute chart
- Identify trend using:
- 20 EMA
Trend Identification:
- Price above 20 EMA → Uptrend
- Price below 20 EMA → Downtrend
- Wait for price to pull back:
- Towards EMA
- Or support/resistance zone
- Look for confirmation candle:
- Bullish (for buy)
- Bearish (for sell)
- Enter in direction of main trend
🟢 Buy Setup (Uptrend Pullback)
- Stock trading above 20 EMA
- Price pulls back near EMA/support
- Bullish candle forms (hammer / bullish engulfing)
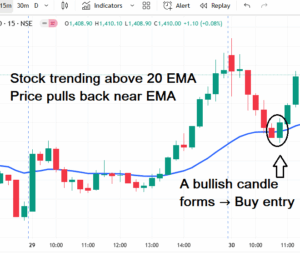
Entry:
👉 Buy after confirmation candle
Stop Loss:
👉 Below pullback low
Target:
👉 Next swing high OR
👉 Maintain 1:2 risk-reward ratio
🔴 Sell Setup (Downtrend Pullback)
- Stock trading below 20 EMA
- Price pulls back near EMA/resistance
- Bearish candle forms (shooting star / bearish engulfing)
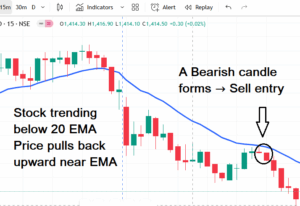
Entry:
👉 Sell after confirmation candle
Stop Loss:
👉 Above pullback high
Target:
👉 Next swing low OR
👉 Maintain 1:2 risk-reward ratio
Example Trade
Stock: Infosys
- Price trending above 20 EMA at ₹1400
- Pullback to ₹1390 near EMA
- Bullish engulfing candle forms
Trade Plan:
- Entry = ₹1392
- Stop Loss = ₹1385 (₹7 risk)
- Target = ₹1406 (₹14 reward)
👉 Perfect 1:2 risk-reward setup
Pro Tips for Pullback Strategy
- ✅ Always trade in trend direction
- ❌ Avoid pullbacks in sideways markets
- Combine with RSI:
👉 40–60 zone = healthy pullback
- Wait for confirmation candle
👉 Don’t enter blindly at EMA
Common Mistake
👉 Entering too early during pullback
Result:
- Price continues falling
- Stop loss hits
👉 Always wait for reversal confirmation
Final Insight
Pullback trading is:
- Safer
- Smarter
- More consistent
👉 It allows you to trade like professionals by entering:
At better price + lower risk
Strategy 10: Opening Pin Bar Trading Strategy
The Opening Pin Bar Strategy is a powerful intraday setup used to capture strong moves at market open. It is based on a simple idea:
👉 Price rejection = Opportunity
A Pin Bar is a candlestick with:
- A long wick (shadow)
- A small body
👉 It shows that the market tried to move in one direction but was strongly rejected.
Concept
This strategy focuses on Pin Bars formed in the first 15–30 minutes of the market:
👉 9:15 AM – 9:45 AM (IST)
Why this time is important:
- High volatility
- Institutional activity (FIIs, DIIs)
- Strong initial moves
👉 A Pin Bar at this time signals:
Smart money rejection → High probability trade
Why Opening Pin Bar Works
- Institutions place large orders at market open
- Sharp moves often get rejected quickly
- That rejection creates a clear directional bias
👉 In simple terms:
Follow the side that wins after rejection
Strategy Setup (15-Min Chart)
- Open a 15-minute chart
- Focus on first 2 candles (till 9:45 AM)
- Identify a Pin Bar candle:
- Long wick
- Small body
- Trade in the opposite direction of the wick
👉 Wick shows rejection
👉 Opposite side shows strength
🟢 Bullish Pin Bar (Buy Setup)
- Long lower wick
- Buyers rejected lower prices
👉 Indicates bullish reversal
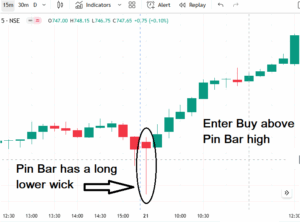
Entry:
👉 Buy above Pin Bar high
Stop Loss:
👉 Below Pin Bar low
Target:
👉 Next resistance OR
👉 Maintain 1:2 risk-reward ratio
🔴 Bearish Pin Bar (Sell Setup)
- Long upper wick
- Sellers rejected higher prices
👉 Indicates bearish reversal
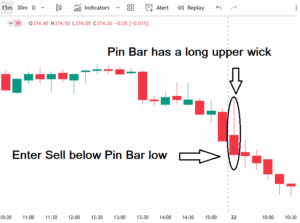
Entry:
👉 Sell below Pin Bar low
Stop Loss:
👉 Above Pin Bar high
Target:
👉 Next support OR
👉 Maintain 1:2 risk-reward ratio
Example Trade
Stock: ICICI Bank
- At 9:30 AM, a bearish Pin Bar forms
- High = ₹985
- Low = ₹975
- Close = ₹978
Trade Plan:
- Entry = ₹975 (below low)
- Stop Loss = ₹985 (₹10 risk)
- Target = ₹955 (₹20 reward)
👉 Perfect 1:2 risk-reward setup
Pro Tips for Pin Bar Strategy
- ✅ Works best in:
- High volume stocks
- Opening session volatility
- ❌ Avoid:
- Weak or small candles (no clear rejection)
- Always wait:
👉 Candle must fully close before entry
- Combine with:
- Support & Resistance
- VWAP
Common Mistake
👉 Trading every pin bar blindly
Not all pin bars are strong
👉 Focus only on:
- Clear wick
- Strong rejection
- Good volume
Final Insight
The Opening Pin Bar Strategy is:
- Advanced but simple
- High probability
- Risk-defined
👉 It helps you capture early market moves like professional traders
Chapter 6: Top 2 Bonus Professional Trading Setups
In this chapter, you’ll learn advanced, professional-level setups used by experienced traders and institutions.
👉 These setups are simple in concept but extremely powerful when executed with discipline.
Setup 1: Previous Day High/Low Breakout Strategy
This is one of the most reliable intraday strategies because it is based on institutional levels.
Concept
The Previous Day High (PDH) and Previous Day Low (PDL) act as strong:
- Resistance (High)
- Support (Low)
👉 These levels are closely watched by:
- Institutions
- Big traders
- Smart money
👉 When price breaks these levels with momentum:
A strong trend often begins
Why This Strategy Works
- These levels are already tested by the market
- Breakout triggers fresh buying/selling pressure
- High probability of trend continuation
Strategy Setup (15-Min Chart)
- Mark:
- Previous day High
- Previous day Low
- Wait for:
- 15-min candle close
- Trade only after confirmed breakout
🟢 Previous Day High Breakout
- Price breaks and closes above yesterday’s high
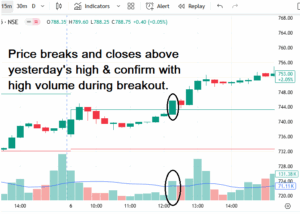
Entry:
👉 Buy at breakout candle close (not at CMP)
Stop Loss:
👉 Below breakout level
Target:
👉 Next resistance OR
👉 Maintain 1:2 risk-reward ratio
🔴 Previous Day Low Breakdown
- Price breaks and closes below yesterday’s low
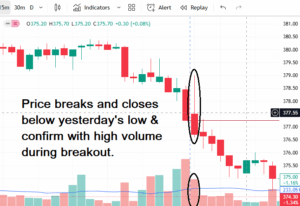
Entry:
👉 Sell at breakout candle close
Stop Loss:
👉 Above breakout level
Target:
👉 Next support OR
👉 Maintain 1:2 risk-reward ratio
Example Trade
Stock: Infosys
- Yesterday’s High = ₹1500
- Yesterday’s Low = ₹1470
Today:
- Price breaks above ₹1500
- Candle closes at ₹1505
Trade Plan:
- Entry = ₹1505
- Stop Loss = ₹1490 (₹15 risk)
- Target = ₹1535 (₹30 reward)
👉 Perfect 1:2 risk-reward trade
Pro Tips for Better Accuracy
- ✅ Always confirm breakout with strong volume
- ❌ Avoid trading during:
- 12 PM – 2 PM (low volume zone)
- Retest Strategy:
👉 If price breaks level and then retests it →
👉 Stronger confirmation entry
Common Mistake
👉 Entering before breakout confirmation
👉 Always wait for:
15-min candle close above/below level
Final Insight
The Previous Day High/Low strategy is:
- Simple
- Powerful
- Institution-based
👉 It works because it follows real market structure and liquidity zones
Setup 2: Pivot Point Breakout Strategy
The Pivot Point Breakout Strategy is a professional-level setup based on pre-defined intraday levels. These levels are widely used by institutions and experienced traders.
👉 Among all pivot levels, R1 (Resistance 1) and S1 (Support 1) are the most important for intraday trading.
Concept
Pivot Points are calculated using the previous day’s price data and act as:
- Dynamic support & resistance levels
- Intraday decision zones
Key Idea:
- R1 Breakout → Bullish Signal (Buy)
- S1 Breakdown → Bearish Signal (Sell)
👉 When price breaks these levels with momentum, it often leads to strong trending moves.
Why This Strategy Works
- Pivot levels are watched by institutional traders
- Breakouts trigger large order flow
- Momentum increases after breakout
👉 In simple terms:
Pivot Breakout = Smart money movement
Strategy Setup (15-Min Chart)
- Add Pivot Points indicator
- Focus only on:
- R1 (Resistance 1)
- S1 (Support 1)
👉 Ignore R2, R3, S2, S3 for simplicity
- Wait for:
- Breakout with strong volume
🟢 Buy Setup (R1 Breakout)
- Price breaks and closes above R1
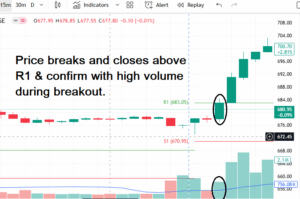
Entry:
👉 Buy at breakout candle close (not at CMP)
Stop Loss:
👉 Below R1
Target:
👉 R2 OR
👉 Maintain 1:2 risk-reward ratio
🔴 Sell Setup (S1 Breakdown)
- Price breaks and closes below S1
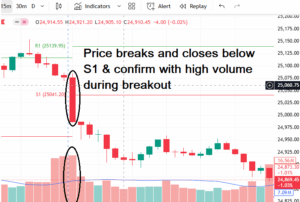
Entry:
👉 Sell at breakout candle close
Stop Loss:
👉 Above S1
Target:
👉 S2 OR
👉 Maintain 1:2 risk-reward ratio
Example Trade
Stock: Tata Motors
- R1 = ₹610
- S1 = ₹590
At 11:00 AM:
- Price breaks above ₹610
- Candle closes at ₹612
Trade Plan:
- Entry = ₹612
- Stop Loss = ₹605 (₹7 risk)
- Target = ₹626 (₹14 reward)
👉 Perfect 1:2 risk-reward trade
Pro Tips for Pivot Strategy
- ✅ Works best in:
- High-volume stocks
- Indices like Nifty & Bank Nifty
- ❌ Avoid:
- Sideways (range-bound) markets
- Strong breakout signal:
👉 When volume increases during breakout
- Best combination:
👉 Pivot + VWAP = high probability setup
Common Mistake
👉 Trading every pivot touch
Pivot levels are for:
👉 Breakouts, not random entries
Final Insight
The Pivot Point Breakout Strategy is:
- Rule-based
- Institutional
- Highly reliable
👉 It gives you clear entry, stop loss, and target — making trading more structured and disciplined.
Chapter Summary
These 2 bonus setups:
✔ Previous Day High/Low Breakout
✔ Pivot Point Breakout
👉 Give you institutional-level entries that work across:
- Stocks
- Indices
- Forex
- Commodities
Chapter 7: Mastering Risk Management in Intraday Trading
Introduction
Risk management is the backbone of trading success.
Most beginners focus only on finding the “perfect strategy” or “best stock,” but they ignore the most important factor:
👉 How much you risk on each trade
The truth is:
Even the best strategy can fail, but a strong risk management system can still keep you profitable.
Professional traders don’t chase profits —
👉 They focus on protecting capital first
Because if your capital is safe,
👉 Opportunities will always come.
1. The Golden Rule: Capital Protection
Your first goal in trading is NOT to make money.
👉 It is to avoid big losses
Rule:
👉 Never risk more than 1–2% of your total capital per trade
Example:
- Capital = ₹1,00,000
- 1% Risk = ₹1,000
- 2% Risk = ₹2,000
👉 This means:
Even if your trade goes wrong, your loss is controlled.
Key Insight:
👉 Protect capital = Stay in the game longer
2. Position Sizing (Quantity Control)
Position sizing decides how many shares you should buy or sell.
👉 It should always depend on your stop loss, not your confidence.
Formula:
Position Size = Risk Amount ÷ (Entry Price – Stop Loss)
Example:
- Capital = ₹1,00,000
- Risk per trade = ₹1,000
- Stock = Reliance
- Entry = ₹2400
- Stop Loss = ₹2380
👉 Risk per share = ₹20
Calculation:
Position Size = ₹1000 ÷ ₹20 = 50 shares
👉 So you should only trade 50 shares, not more.
Key Insight:
👉 Bigger quantity ≠ Bigger profit
👉 Controlled quantity = Controlled risk
3. Risk-to-Reward Ratio (Always 1:2)
This is the most powerful concept in trading.
Rule:
👉 Always maintain Risk : Reward = 1 : 2
Example:
- Entry = ₹500
- Stop Loss = ₹490 (Risk = ₹10)
- Target = ₹520 (Reward = ₹20)
👉 Ratio = 1:2
Why this works:
Even if:
- 50% trades fail
👉 You can still be profitable
4. Daily Loss Limit
One of the biggest mistakes beginners make is revenge trading.
Rule:
👉 Set a daily loss limit of 2–3% of capital
Example:
- Capital = ₹1,00,000
- Daily loss limit = ₹3,000
👉 Once hit → STOP trading for the day
Key Insight:
👉 Capital = Oxygen
👉 Without it, you cannot trade
5. Avoid Overtrading
More trades ≠ More profit
👉 More trades = More mistakes
Rule:
- Take only 2–3 high-quality trades per day
- Focus on quality over quantity
Beginner Mistake:
- Taking 10–15 random trades
Pro Mindset:
👉 Wait → Observe → Execute only best setups
6. Emotional Discipline
Trading is 80% psychology and 20% strategy.
Rules:
- Accept losses as part of the game
- Never remove stop loss
- Never average losing trades
- Trust your system
👉 Important Truth:
Even if:
- First 3 trades hit stop loss
👉 One good trade (1:2 RR) can recover everything
Real Example: 1:2 Risk-Reward System
Let’s understand the power of risk management:
Scenario: 10 Trades
- 6 Loss trades → -₹6,000
- 4 Winning trades → +₹8,000
Final Result:
👉 Net Profit = +₹2,000
Key Learning:
👉 Even with 40% accuracy, you are profitable
Final Summary
Always follow these rules:
✔ Risk only 1% per trade
✔ Maintain 1:2 risk-reward ratio
✔ Respect your stop loss
✔ Stop trading after daily loss limit
✔ Focus on quality trades
Final Insight
Most traders try to predict the market.
Professionals focus on managing risk.
👉 Real success in trading comes from:
Controlling losses, not chasing profits
Chapter 8: Psychology of a Successful Intraday Trader
Intraday trading is not just about charts, indicators, or strategies —
👉 it is primarily a mind game.
Two traders can follow the exact same setup:
- One makes consistent profits
- The other keeps losing
👉 The difference is not strategy — it is psychology
If you don’t control your mind,
👉 the market will control your results.
1. Discipline is Your Real Edge
Discipline is what separates beginners from professionals.
👉 It means:
- Following your plan strictly
- Not changing rules during the trade
- Accepting outcomes without emotional reaction
✅ What Discipline Looks Like:
- Stop loss hit → Exit immediately
- Target achieved → Book profit
- No second guessing
❌ What Undisciplined Traders Do:
- Move stop loss
- Hold losing trades
- Double position to recover loss
Example:
You planned to risk ₹1,000
- Disciplined trader → accepts loss
- Undisciplined trader → increases position
👉 Result: Bigger loss
Key Insight:
👉 Discipline protects your capital
👉 Indiscipline destroys it
2. Avoid Overtrading & Revenge Trading
This is the biggest trap for beginners.
Overtrading
- Taking too many trades
- Trading out of boredom
👉 Result:
- Capital loss
- Mental exhaustion
Revenge Trading
- After loss → trying to recover quickly
- Emotional trading
👉 Result:
- Bigger losses
✅ Rule:
👉 Take only 2–3 quality trades per day
👉 If daily loss limit hits → Stop trading
3. Handling Fear & Greed
These are the two biggest enemies in trading.
Fear
- Exiting trades too early
Example:
- Entry = ₹2400
- Target = ₹2450
- Exit at ₹2410
👉 Missed opportunity
Greed
- Holding trades beyond target
Example:
- Target = ₹2450
- Hold for ₹2480
- Price reverses → profit lost
✅ Solution:
👉 Follow 1:2 risk-reward strictly
Key Insight:
👉 Emotion = Loss
👉 System = Profit
4. Patience to Wait for Setup
Most losses happen because traders cannot wait.
❌ Beginner Behavior:
- Enter trades randomly
- Trade out of boredom
✅ Professional Behavior:
- Wait for perfect setup
- Trade only when conditions match
Pro Tip:
👉 Think like a hunter
You don’t shoot at every movement —
👉 You wait for the right opportunity
5. Confidence vs Ego
This is a very important difference.
✅ Confidence
- Trusting your system
- Accepting losses
- Executing trades without hesitation
❌ Ego
- Refusing to accept loss
- Fighting the market
- Averaging losing trades
Truth:
👉 Market is always right
👉 Ego = account blow
6. Build a Professional Trading Routine
Without a routine, trading becomes random.
Pre-Market (Preparation)
- Check global markets
- Identify trend
- Create watchlist (5–7 stocks)
- Mark key levels
Market Hours (Execution)
- Trade only when setup appears
- No random entries
- Follow rules strictly
Post-Market (Review)
- Analyze trades
- Maintain trading journal
- Learn from mistakes
Key Insight:
👉 Routine creates consistency
Trader Story: From Loss to Consistency
Rahul, a young IT professional, started intraday trading after watching online videos.
👉 Day 1:
- Made ₹2,000 profit in 30 minutes
- Got overconfident
👉 Within 1 week:
- Account dropped from ₹50,000 → ₹30,000
Why?
- Overtrading
- Revenge trading
- No system
Frustrated, he almost quit.
Then he learned one key truth:
👉 “Trading is 90% psychology and 10% strategy”
Rahul’s New Plan:
- Risk only ₹1,000 per trade
- Take maximum 2 trades per day
- Maintain trading journal
- Accept losses
👉 Result (3 months later):
- Account recovered: ₹30,000 → ₹60,000
- Became consistent
Lesson:
👉 Success didn’t come from a new strategy
👉 It came from discipline and mindset
Final Takeaway
Intraday trading success depends more on psychology than strategy
Always Remember:
✔ Control your emotions
✔ Follow your system
✔ Accept losses
✔ Stay disciplined
Final Insight
The market tests your patience before rewarding your discipline.
👉 If you master:
- Fear
- Greed
- Ego
Then you are already ahead of 90% of traders
Chapter 9: The Power of Discipline in Intraday Trading
If risk management protects your capital and psychology controls your emotions, then discipline is what makes everything work together.
👉 Without discipline, even the best strategy will fail.
👉 With discipline, even a simple strategy can generate consistent profits.
What Discipline Really Means
Discipline in trading is not just about controlling emotions.
👉 It means following your rules without exception.
- No shortcuts
- No impulsive decisions
- No rule-breaking
👉 Even when:
- You feel bored
- You feel overconfident
- You feel frustrated
You still follow your system.
Key Insight:
👉 Discipline = Doing the right thing consistently, not occasionally
Core Areas of Discipline Every Trader Must Master
1. Entry & Exit Discipline
This is where most traders fail.
✅ Rules:
- Enter only when your setup is 100% valid
- Never trade on:
- Gut feeling
- Tips
- Book profit at your predefined target
- Exit immediately when stop loss is hit
❌ Common Mistakes:
- Moving stop loss
- Holding losing trades
- Changing targets
Golden Rule:
👉 Your system decides, not your emotions
2. Trade Frequency Discipline
More trades do NOT mean more profit.
✅ Rules:
- Take only 2–3 high-quality trades per day
- Avoid trades in:
- Sideways market
- Low-volume conditions
❌ Beginner Mistake:
- Trading out of boredom
Truth:
👉 No trade is better than a bad trade
3. Capital Discipline
This is directly linked to survival in trading.
✅ Rules:
- Risk only 1–2% per trade
- Keep position size controlled
- Stay consistent with risk
❌ Dangerous Behavior:
- Increasing lot size after loss
- Trying to recover losses quickly
Key Insight:
👉 Consistency builds capital, not aggression
4. Learning Discipline
Growth in trading comes from review, not just execution.
✅ Rules:
- Review trades daily
- Maintain a trading journal
- Note:
- Entry & exit
- Mistakes
- Emotions
Golden Rule:
👉 A disciplined trader learns daily, not just earns
5. Lifestyle Discipline
Your lifestyle directly impacts your trading performance.
✅ Rules:
- Sleep properly
- Trade with full focus
- Avoid distractions
Mindset:
👉 Treat trading like a business, not entertainment
Example: Two Traders
✅ Trader A (Disciplined)
- Takes 2 trades
- 1 win, 1 loss
- Follows 1:2 risk-reward
👉 Result: Net profit
❌ Trader B (Undisciplined)
- Takes 8 random trades
- Ignores stop loss
- Adds positions
👉 Result: Big loss
Lesson:
👉 Success is not about knowledge
👉 It’s about discipline
Pro Tips to Build Strong Discipline
- Write your trading rules and keep them visible
- Before every trade, ask:
👉 “Am I following my system or my emotions?” - Use a checklist before entry
- Reward yourself for following rules, not just for winning
Final Note
Discipline is your real edge in trading.
- Risk management → Protects capital
- Psychology → Controls emotions
- Discipline → Ensures execution
Final Insight
👉 Strategies give you opportunities
👉 Discipline gives you results
If you master discipline,
👉 consistency becomes inevitable.
Chapter 10: Building A Winning Intraday Trading Routine
Intraday trading is not just about strategies and indicators —
👉 it’s about consistency, discipline, and structure.
Most beginners fail not because they lack knowledge,
👉 but because they don’t follow a clear daily routine.
Just like athletes follow a strict training schedule,
👉 traders need a routine to stay focused, avoid emotional mistakes, and perform consistently.
1. Pre-Market Preparation
(8:30 AM – 9:15 AM)
Preparation is where winning trades begin.
Check Global Markets & News
- Look at:
- SGX Nifty
- Dow Jones
- Asian markets
- Track key news:
- Crude oil
- USD-INR
- Inflation / RBI policy
Create a Watchlist
- Select 5–7 stocks only
- Focus on:
- High volume
- News-based stocks
- Strong technical levels
👉 Example:
If TCS has results today → add it to watchlist
Mark Key Levels
- Previous day:
- High
- Low
- Close
- Pivot levels (R1, S1)
- Support & resistance
Rule:
👉 Never trade random stocks — stick to your watchlist
2. Market Opening
(9:15 AM – 9:45 AM)
This is the most volatile phase.
Observe First, Don’t Jump
- Wait for first 15–30 minutes
- Let market settle
Look for Early Clues
- Breakout above previous high → bullish
- Rejection from support → possible reversal
Rule:
👉 Enter only when:
- Setup is clear
- Volume confirms
- Risk-reward is valid
3. Mid-Market Trading
(10:00 AM – 12:30 PM)
This is the best trading window.
Why This Time Works
- Stable trends
- Better clarity
- Less noise
What to Do
- Use 15-minute timeframe
- Confirm setups with:
- EMA
- VWAP
Focus on Risk-Reward
- Always aim for 1:2 ratio
- Example:
- Risk ₹5 → Target ₹10
Rule:
👉 2–3 quality trades are enough
4. Afternoon Session
(12:30 PM – 2:30 PM)
This is usually a slow market phase.
What to Do
- Manage existing trades
- Trail stop loss
- Book partial profits
What to Avoid
- Forced trades
- Overtrading
Rule:
👉 No trade is also a smart decision
5. Closing Session
(2:30 PM – 3:15 PM)
This is the second opportunity window.
What Happens Here
- Institutions become active
- Strong moves can happen
Caution
- Avoid new trades unless:
- Strong breakout
- Clear setup
Rule:
👉 Don’t overtrade at the end of the day
6. Post-Market Review
(After 3:30 PM)
This is the most powerful but most ignored step.
Review Your Trades
Write in journal:
- Entry
- Stop Loss
- Target
- Reason for trade
Self-Analysis
Ask yourself:
- Did I follow my plan?
- Did I break any rules?
- Was I emotional?
Prepare for Next Day
- Mark today’s:
- High
- Low
- Close
- Identify high-volume stocks
Rule:
👉 Growth comes from review, not just trading
Trader Story: The Impulsive Trader
Ravi started trading without any routine.
His Mistakes:
- Checked market randomly
- Traded 8–10 times daily
- No plan, no discipline
👉 Result: Losses despite some wins
His New Routine:
- Watchlist (5 stocks)
- Mark key levels
- Max 3 trades per day
- Daily journal
👉 Result (2 months later):
- Improved consistency
- Better decision-making
Lesson:
👉 Routine beats strategy
Daily Trading Checklist
Before Market
- Check global markets
- Review news/events
- Mark key levels
- Create watchlist
- Define risk per trade
During Market
- Wait for first 15-min candle
- Confirm with volume
- Maintain 1:2 risk-reward
- Place stop loss
- Max 2–3 trades
After Market
- Record trades
- Review mistakes
- Update watchlist
Final Takeaways
- Routine = Consistency
- Consistency = Profitability
Always Remember:
✔ Fixed trading hours (best: 9:30 – 11:30)
✔ Focus on quality setups
✔ Review daily
Final Insight
Intraday trading success is not built overnight.
It is built through:
👉 Discipline
👉 Preparation
👉 Continuous improvement
Final Line:
“Trade your plan, or the market will trade you.”
Chapter 11: Building Your Own Intraday Trading Setup
Trading without a plan is like driving without a map —
👉 you may move, but you won’t reach your destination.
A trading plan gives you:
- Clarity
- Discipline
- Consistency
👉 It removes guesswork and emotional decisions.
In this chapter, you’ll build a complete intraday trading plan step by step.
1. Define Your Trading Goals
Before entering the market, you must know:
👉 Why are you trading?
- Side income?
- Full-time career?
Set Realistic Expectations
- ✅ Good return: 5–10% per month
- ❌ Unrealistic: 50–100% monthly
Key Insight:
👉 Slow and consistent growth = long-term success
2. Choose Your Trading Capital
Your capital defines your risk and strategy.
✅ Guidelines:
- Start with: ₹50,000 – ₹1,00,000
- Use only your own money
- Never use:
- Borrowed money
- Loan money
Rule:
👉 Trade only with money you can afford to lose
3. Select Market & Time Frame
Market Selection:
- Nifty 50 stocks
- Bank Nifty stocks
- High liquidity stocks
👉 Avoid:
- Penny stocks
- Illiquid stocks
Time Frame:
👉 Best: 15-minute chart
Why?
- Balanced speed
- Better accuracy
- Less noise
4. Decide Your Strategy
One of the biggest mistakes beginners make:
👉 Trying too many strategies
✅ Solution:
Pick 1–2 strategies only, such as:
- EMA Crossover
- Previous Day High/Low Breakout
- Pivot Point Breakout
Pro Tip:
👉 Test strategies using:
- Paper trading
- Backtesting
Rule:
👉 Master one strategy before adding another
5. Risk Management Rules
This is the foundation of your plan.
✅ Must-Follow Rules:
- Risk per trade = 1–2% of capital
- Risk-Reward = minimum 1:2
- Maximum trades = 2–3 per day
- Daily loss limit = 3% of capital
Rule:
👉 If daily loss limit is hit → STOP trading
6. Entry & Exit Rules
Clarity in entry & exit removes confusion.
✅ Entry Rules:
- Trade only when setup is valid
- Confirm with:
- Volume
- Price action
✅ Exit Rules:
- Exit at:
- Target
- Stop loss
❌ Avoid:
- Changing stop loss
- Changing target mid-trade
Golden Rule:
👉 Plan the trade → Trade the plan
7. Maintain a Trading Journal
This is your growth tool.
Record Every Trade:
- Stock name
- Entry / Exit
- Stop Loss
- Profit / Loss
- Reason for trade
- Lesson learned
Why Journal Matters:
👉 It helps you:
- Identify mistakes
- Improve strategy
- Build discipline
8. Mindset & Discipline Rules
Your mindset decides your results.
✅ Rules:
- Don’t chase losses
- Don’t trade emotionally
- Follow your system
❌ Avoid:
- Revenge trading
- News-based impulsive trades
Truth:
👉 Discipline > Strategy
Example: Simple Daily Trading Plan
Morning (9:00 – 9:15 AM)
- Mark previous day High & Low
- Plot Pivot Points (R1, S1)
- Create watchlist (5–7 stocks)
Trading Time (9:30 – 11:30 AM)
- Look for:
- Breakouts
- High-probability setups
- Enter with:
- Stop loss
- Target
Afternoon (12:30 – 2:30 PM)
- Trade only if strong setup appears
- Otherwise, avoid trades
Closing Routine (After 3:15 PM)
- Review trades
- Update journal
- Stop trading
👉 No last-minute gambling trades
Final Takeaway
A successful trading plan is built on:
👉 Consistency + Discipline + Risk Management
Final Insight
You don’t need a perfect strategy.
You need a perfect system.
👉 If you follow your trading plan daily:
- Losses will be controlled
- Profits will become consistent
Chapter 12: Order Types & Execution in Intraday Trading
In intraday trading, success is not only about what you trade, but also about how you execute your trade.
👉 Many beginners focus only on strategies and ignore execution.
👉 Professional traders know that order execution = risk control + precision
A small mistake in order type can:
- Increase loss
- Reduce profit
- Destroy your risk management
Why Order Execution Matters
- Ensures accurate entry & exit
- Protects from unexpected losses
- Removes emotional decisions
👉 In simple terms:
Good execution = Better results
1. Market Order
A Market Order executes instantly at the best available price.
✅ When to Use:
- When you want immediate entry or exit
- In fast-moving stocks
Risk:
- Slippage (price may change quickly)
Example:
- Reliance at ₹2400
- You place Buy Market Order
👉 You may get ₹2401 or ₹2402
Insight:
👉 Speed > Price control
2. Limit Order
A Limit Order allows you to set the exact price.
✅ When to Use:
- When you want price control
- For planned entries
Risk:
- Order may not execute
Example:
- You want Infosys at ₹1450
- Place Buy Limit Order
👉 If price touches ₹1450 → trade executed
👉 If not → no trade
Insight:
👉 Price control > Speed
3. Stop-Loss Order (SL Order)
This is the most important order for risk management.
✅ Purpose:
- Limits your losses
- Protects your capital
Example:
- Buy Tata Motors at ₹700
- Target = ₹720
- Stop Loss = ₹690
👉 If price hits ₹690 → trade exits automatically
Risk:
- In fast markets, price may gap beyond SL
Golden Rule:
👉 Never trade without stop loss
4. Bracket Order (BO)
A Bracket Order combines:
- Entry
- Stop Loss
- Target
👉 All in one order
✅ Best For:
- Beginners
- Fixed risk-reward trading
Example:
- Buy ICICI Bank at ₹1000
- Target = ₹1020
- Stop Loss = ₹990
👉 System manages everything
Benefit:
👉 Removes emotional decisions
Note:
- Not available in all brokers
5. Cover Order (CO)
A Cover Order is:
👉 Entry + compulsory Stop Loss
✅ Best For:
- Risk-controlled trading
- Volatile stocks
Example:
- Buy HDFC Bank at ₹1600
- Stop Loss = ₹1585
👉 Risk is fixed
Limitation:
- Less flexibility in exit
6. Practical Trade Setup Example
Let’s combine everything:
Stock: Adani Ports
- Current Price = ₹1370
- Breakout level = ₹1380
Trade Plan:
- Buy Limit Order = ₹1380
- Stop Loss = ₹1365
- Target = ₹1400
👉 Risk = ₹15
👉 Reward = ₹30
👉 Ratio = 1:2
Result:
- Structured trade
- Controlled risk
- No emotional decision
Common Mistakes in Order Execution
- Trading without stop loss
- Using market order in low liquidity
- Entering without plan
- Changing orders mid-trade
Final Takeaway
Choosing the right order type is as important as choosing the right stock.
Always Remember:
✔ Use Limit Order for planned entry
✔ Use Market Order for quick execution
✔ Always use Stop Loss
✔ Prefer BO/CO for discipline
Final Insight
A professional trader is not defined by strategy alone —
👉 but by how well they execute trades with discipline.
Chapter 13: Market Microstructure & Liquidity in Intraday
Most beginners focus only on charts and indicators.
But professional traders understand something deeper:
👉 How the market actually works behind the scenes
This is called market microstructure — and it plays a huge role in your trading results.
What is Market Microstructure?
Market microstructure explains:
- How buy and sell orders interact
- How prices actually move
- How trades get executed
👉 In simple terms:
It’s the engine behind price movement
Why It Matters:
- Helps you avoid fake moves
- Improves execution quality
- Reduces slippage
- Makes your trading more professional
Liquidity Explained
Liquidity means how easily you can:
👉 Buy or sell a stock without affecting its price
✅ High Liquidity (Best for Intraday)
- Heavy trading volume
- Easy entry & exit
- Stable price movement
Examples:
- Reliance
- TCS
- HDFC Bank
❌ Low Liquidity (Dangerous)
- Low volume
- Difficult execution
- Sudden price spikes
Examples:
- Small-cap stocks
- Penny stocks
Rule:
👉 Always trade high liquidity stocks
Pro Tip:
👉 Check Average Daily Traded Volume (ADTV)
- Prefer stocks with:
👉 ₹500 Cr+ daily turnover
Bid–Ask Spread
Every stock has two prices:
- Bid Price → Price buyers are willing to pay
- Ask Price → Price sellers want
Spread = Ask – Bid
✅ Narrow Spread
- High liquidity
- Better execution
- Lower slippage
❌ Wide Spread
- Low liquidity
- High slippage
- Risky trades
Rule:
👉 Always choose stocks with tight spread
Order Book Depth
Order book shows:
👉 Pending buy & sell orders in the market
✅ Thick Order Book
- Many buyers & sellers
- Stable movement
❌ Thin Order Book
- Few participants
- Sudden spikes
- Unpredictable movement
Example:
Liquid Stock (Reliance)
- 10,000 buyers at ₹2400
- 9,500 sellers at ₹2401
👉 Smooth movement
Illiquid Stock (Small-cap)
- 300 buyers at ₹50
- 50 sellers at ₹51
👉 Price can jump suddenly
Slippage (Hidden Loss)
Slippage happens when:
👉 You don’t get the expected price
Example:
Liquid Stock:
- Buy 100 shares at ₹2400
👉 Filled instantly
Illiquid Stock:
- Buy 100 shares at ₹50
- Only 20 shares available
- Price jumps to ₹51
👉 You pay higher price
Insight:
👉 Slippage = Hidden loss
Pro Tips for Smart Traders
- ✅ Trade only:
- F&O stocks
- Nifty 50 / Bank Nifty stocks
- ❌ Avoid:
- Illiquid small-cap stocks
- Use:
- Limit orders for better price control
- Always check:
- Bid–Ask spread
- Order book depth
Final Takeaway
Liquidity and order flow are often ignored,
👉 but they directly impact your profit and loss.
Always Remember:
✔ High liquidity = Smooth trading
✔ Low liquidity = High risk
✔ Narrow spread = Better execution
✔ Slippage = Hidden loss
Final Insight
You don’t just trade charts —
👉 you trade orders, liquidity, and market behavior
Understanding this gives you an edge over most traders.
Chapter 14: Common Mistakes in Intraday Trading & How to Avoid Them
Even with the best strategies, most beginners fail — not because they lack knowledge,
👉 but because they repeat basic mistakes again and again.
👉 If you simply avoid these mistakes, you are already ahead of 80% of traders.
Mistake 1: Trading Without a Plan
Many traders enter trades based on:
- Gut feeling
- Tips
- Random signals
👉 Result: No clarity → Emotional decisions → Losses
✅Solution:
- Always have a clear trading plan
- Define:
- Entry
- Stop Loss
- Target
Rule:
👉 Trade your plan, not your emotions
Mistake 2: Ignoring Stop Loss
This is the most dangerous mistake.
Problem:
- Traders avoid stop loss
- Hope market will reverse
👉 Small loss → Big loss → Account damage
✅Solution:
- Place stop loss immediately after entry
- Risk only 1–2% per trade
Golden Rule:
👉 No Stop Loss = No Trading
Mistake 3: Overtrading
Beginners believe:
👉 More trades = More profit
Reality:
👉 More trades = More mistakes
Causes:
- Greed
- Boredom
- Lack of patience
✅ Solution:
- Take only 2–3 quality trades per day
- Focus on high-probability setups
Truth:
👉 Quality beats quantity
Mistake 4: Revenge Trading
After a loss, traders try to recover quickly.
Problem:
- Emotional decisions
- Random entries
- Bigger losses
✅ Solution:
- Accept losses as part of trading
- Follow daily loss limit
Rule:
👉 Hit loss limit → Stop trading
Mistake 5: Chasing Breakouts Late
Entering after the move has already happened.
Problem:
- High risk
- Low reward
✅ Solution:
- Enter at breakout level with confirmation
- If missed → skip trade
Insight:
👉 Missed trade is better than bad trade
Mistake 6: Ignoring Risk–Reward Ratio
Taking trades like:
- Risk ₹10 to make ₹5
Problem:
- Even with high accuracy → losses
✅ Solution:
- Maintain minimum 1:2 risk-reward ratio
Rule:
👉 Risk less, aim more
Mistake 7: Not Reviewing Trades
Most traders:
- Trade daily
- Never analyze
Problem:
- Same mistakes repeat
✅ Solution:
Maintain a trading journal:
- Entry
- Exit
- Stop Loss
- Reason
- Emotion
Rule:
👉 Review weekly to improve
Final Tip for Beginners
Intraday trading is NOT about:
- Making money every day
👉 It is about:
- Protecting capital
- Following rules
- Staying disciplined
Final Takeaway
Avoid these mistakes and you will:
✔ Reduce losses
✔ Improve consistency
✔ Build confidence
Final Insight
Success in trading is not about doing something extraordinary.
👉 It’s about avoiding simple mistakes consistently.
Chapter 15: Your Roadmap to Consistent Profit
You’ve now completed a full journey through intraday trading — from basics to advanced strategies, risk management, psychology, and discipline.
But here’s the truth:
👉 Knowledge alone doesn’t make money — execution does.
Success in trading comes down to three things:
- Discipline
- Consistency
- Patience
Step-by-Step Roadmap to Consistency
1. Start Small, Trade Safe
Every professional trader starts small.
They don’t chase profits — they focus on survival first.
✅ Rules:
- Begin with limited capital
- Risk only 1–2% per trade
- Focus on learning, not earning
Mindset:
👉 First goal = Survival
👉 Second goal = Consistency
👉 Third goal = Profit
2. Master 1–2 Setups First
One of the biggest beginner mistakes is this:
👉 Trying too many strategies at once
✅ Solution:
Pick only 1–2 proven setups, for example:
- VWAP Breakout
- Previous Day High/Low Breakout
Rule:
👉 Master first → Expand later
3. Follow a Daily Routine
Consistency doesn’t come from talent.
👉 It comes from routine.
Pre-Market:
- Identify key levels
- Shortlist 3–5 stocks
During Market:
- Trade only when setup appears
- Avoid random entries
Post-Market:
- Review trades
- Update trading journal
🎯 Rule:
👉 Routine = Discipline in action
4. Stay Disciplined with Risk Management
Risk management is your foundation.
Without it, even the best strategy will fail.
✅ Rules:
- Always maintain 1:2 risk-reward ratio
- Accept losses calmly
- Never revenge trade
Insight:
👉 Losses are not failure — they are part of the system
5. Control Your Mindset
Your mindset decides your success.
Not your strategy.
✅ Focus On:
- Patience
- Discipline
- Emotional control
❌ Avoid:
- Overtrading
- Greed
- Fear-based decisions
Truth:
👉 Trading is a marathon, not a sprint
The Big Picture
Intraday trading is NOT about:
❌ One big winning trade
👉 It is about:
✔ Small consistent profits
✔ Controlled losses
✔ Long-term growth
Final Words
Most beginners fail because they chase fast money.
Professionals succeed because they follow a process.
Always Remember:
✔ Process > Profits
✔ Discipline > Emotions
✔ Consistency > Luck
👉 If you:
- Follow your plan
- Avoid common mistakes
- Stay disciplined
👉 Then success becomes inevitable over time.
Thank You for Reading
Trading is not about luck.
👉 It is about:
- Discipline
- Patience
- Strategy
🚀 Keep improving.
📈 Keep learning.
💡 Keep trading smart.
👉 For more strategies and updates:
www.intradaytrend.com
Disclaimer
This eBook is created for educational purposes only.
- It does NOT provide financial advice
- It does NOT recommend specific stocks
Important Notes:
- Trading involves risk, including capital loss
- Past performance does NOT guarantee future results
- Always do your own research
🧾 Advisory:
👉 Consult a SEBI-certified financial advisor before making any investment decisions
⚠️ Responsibility Clause:
By using this material, you agree that:
- You are fully responsible for your trading decisions
- The author/publisher is not liable for any losses
Final Insight
👉 Don’t just trade.
👉 Trade with discipline. Trade with confidence. Trade with purpose.