Free Fibonacci retracement calculator for Indian traders.
Fibonacci Retracement Calculator
Free Intraday Trend Finder
Fibonacci Retracement Calculator in India
The Fibonacci Retracement Calculator helps Indian traders identify potential pullback levels within a price trend. In trading, markets rarely move in a straight line. Instead, prices advance in waves, followed by temporary corrections before the trend continues. Fibonacci retracement levels help traders estimate where these corrections may end.
This free calculator is especially useful for NSE intraday traders, swing traders, and positional traders who want to plan entries and exits using logical price zones rather than guesswork.
How Does the Fibonacci Retracement Calculator Work?
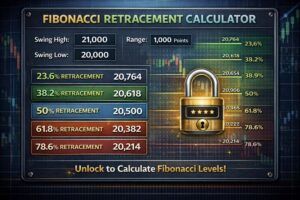
The calculator measures the price movement between a swing high and a swing low. It then applies Fibonacci ratios to that range to identify retracement levels.
Steps to use the calculator:
Enter the swing high price
Enter the swing low price
Click calculate
The calculator instantly displays key Fibonacci retracement levels such as 23.6%, 38.2%, 50%, 61.8%, and 78.6%.
These levels indicate possible price reversal or consolidation zones.
Fibonacci Retracement Formula Used
The formula used is:
Retracement Level = Swing High − (Swing Range × Fibonacci Ratio)
Where:
Swing Range = Swing High − Swing Low
Common Fibonacci Ratios = 0.236, 0.382, 0.5, 0.618, 0.786
Example Calculation
Swing High = ₹22,500
Swing Low = ₹22,000
Swing Range = ₹500
61.8% Retracement Level = 22,500 − (500 × 0.618)
= ₹22,191
This means price may find support or resistance near ₹22,191.
Why Fibonacci Retracement Is Important in Trading
Fibonacci levels help traders:
Plan pullback entries in trending markets
Identify logical stop loss placement
Set realistic target zones
Avoid emotional decision making
Professional traders often wait for price to retrace to a Fibonacci level before entering trades. This improves risk-reward structure.
Using Fibonacci Retracement in Intraday Trading
In intraday trading, markets frequently pull back before continuing the main trend. Instead of chasing price, traders use Fibonacci levels to enter at better prices.
For example:
In an uptrend, traders look for buying opportunities near 38.2% or 61.8% levels.
In a downtrend, retracement levels act as resistance zones.
Common Fibonacci Levels Explained
23.6% – Shallow pullback, strong trend
38.2% – Healthy retracement
50% – Midpoint correction
61.8% – Golden ratio level
78.6% – Deep retracement
Each level represents a potential reaction area.
Who Should Use This Calculator?
This Fibonacci Retracement Calculator is useful for:
Intraday traders
Swing traders
Options traders
Beginners learning technical analysis
NSE equity traders
Frequently Asked Questions (FAQs)
What is Fibonacci retracement in trading?
It is a technical analysis method used to find potential pullback levels.
Which Fibonacci level is most important?
The 61.8% level is widely considered the most important.
Can beginners use Fibonacci retracement?
Yes, it helps beginners identify structured price zones.
Is this calculator useful for NSE traders?
Yes, it is designed for Indian market traders.
Related Calculators
For official Nifty market data, refer to the National Stock Exchange of India (NSE).
Disclaimer
This calculator is for educational purposes only and does not provide trading or investment advice.