Free moving average crossover calculator for Indian traders.
Moving Average Crossover Calculator
Free Stock Trend Finder
Moving Average Crossover Calculator in India
The Moving Average Crossover Calculator helps traders identify potential trend reversal signals using two moving averages. A crossover occurs when a short-term moving average crosses above or below a long-term moving average. This technique is widely used in technical analysis because it simplifies market trends into clear directional signals.
In the Indian stock market, particularly for NSE traders, moving average crossovers are commonly applied in intraday as well as swing trading strategies. Since moving averages smooth out price fluctuations, they help traders understand the overall market direction. Therefore, crossover signals often indicate possible trend shifts. As a result, traders can plan entries and exits more systematically.
How Does the Moving Average Crossover Calculator Work?
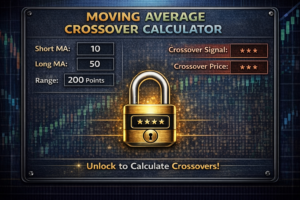
The calculator requires two inputs: a short-term moving average value and a long-term moving average value. Once these numbers are entered, the tool compares them to determine whether a bullish or bearish crossover exists. Because this process is straightforward, traders can quickly interpret trend signals.
Unlike complicated indicators, moving average crossovers focus on trend structure. Moreover, they work effectively across different timeframes, including intraday, daily, and weekly charts.
Crossover Rules
A bullish crossover, also called a Golden Cross, happens when the short-term moving average rises above the long-term moving average. This indicates strengthening upward momentum.
On the other hand, a bearish crossover, known as a Death Cross, occurs when the short-term moving average falls below the long-term moving average. This suggests increasing downward pressure.
When both averages are equal, the market often reflects a neutral or consolidation phase.
Example Calculation
Short-term MA = 20
Long-term MA = 50
If the 20 MA moves above the 50 MA, a bullish signal forms. Conversely, if the 20 MA drops below the 50 MA, a bearish signal appears.
This simple comparison allows traders to react quickly to changing trends.
Why Moving Average Crossovers Matter
Markets often move in trends rather than randomly. Moving averages filter out short-term noise and highlight the broader direction. Therefore, crossover signals provide structured trend identification.
This method helps traders:
Identify trend reversals
Avoid false breakouts
Stay aligned with market momentum
Improve entry timing
Professional traders frequently combine crossovers with other tools to confirm signals.
Using Moving Average Crossovers in Intraday Trading
Intraday traders prefer shorter moving averages, such as 9 and 21 periods, because these respond faster to price changes. When a bullish crossover occurs with rising volume, traders may enter long positions. However, they still confirm signals with support resistance levels.
Conversely, a bearish crossover during high volatility can signal short opportunities. Nevertheless, traders should always wait for confirmation.
Using Crossovers in Swing Trading
Swing traders often use 50-day and 200-day moving averages. A Golden Cross on these timeframes may indicate the start of a long-term uptrend. Conversely, a Death Cross can warn of a potential downtrend.
Because swing trading involves holding positions longer, crossovers help traders align with major trends.
Common Mistakes Traders Make
Some traders rely solely on crossover signals without confirmation. Others enter trades during sideways markets, where crossovers give false signals. Additionally, ignoring risk management increases losses.
This calculator helps traders understand signals clearly but should be combined with other analysis tools.
Who Should Use This Calculator?
Intraday traders
Swing traders
Trend-following traders
NSE equity traders
Futures traders
Benefits of This Tool
Simple to understand
Works in all timeframes
Provides structured trend signals
Helps reduce emotional trading
FAQs
What is a Golden Cross?
It is when a short-term MA crosses above a long-term MA.
What is a Death Cross?
It is when a short-term MA crosses below a long-term MA.
Are crossovers reliable?
They are useful but should be combined with confirmation tools.
Is this tool suitable for Indian markets?
Yes, it works well for NSE trading.
Related Calculators
Disclaimer
This calculator is for educational purposes only and does not provide trading or investment advice.