Free Price Channel calculator for Indian traders.
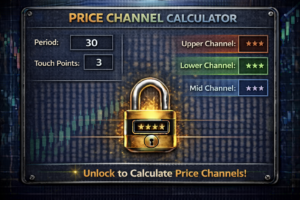
Price Channel Calculator
Free Equity Trend Finder
Price Channel Calculator in India
The Price Channel Calculator helps traders identify where the current price stands within a defined high–low range. Many traders enter trades without understanding whether price is near support, resistance, or mid-range. This leads to buying at the top of a range or selling at the bottom, resulting in poor risk-reward and frequent stop losses. Understanding price position inside a channel improves timing and discipline.
In the Indian stock market, price often moves within channels before breaking out into trends. These channels represent natural support and resistance boundaries. This calculator simplifies channel analysis using the highest and lowest price of a chosen period.
What is a Price Channel?
A price channel is the range formed between the highest and lowest price over a specific period. It represents the market’s short-term boundaries.
Upper Channel – Resistance zone
Lower Channel – Support zone
Mid Channel – Neutral area
Professional traders watch channels to plan breakouts and pullback trades.
Why Price Channel Matters for Indian Traders
Indian markets frequently move sideways before big directional moves. When channel position is known:
Entries become structured
Breakout probability improves
False trades reduce
Risk management becomes logical
Trading without channel awareness leads to emotional entries near extremes.
How the Price Channel Calculator Works
This calculator uses:
Highest price (period high)
Lowest price (period low)
Current price
Logic:
Position = (Price − Low) ÷ (High − Low)
If price is near the upper boundary, breakout potential increases. If near the lower boundary, support reaction becomes likely.
Channel Trading vs Blind Trading
Channel-based trading aligns entries with market structure. Blind trading ignores range context.
Channel trading offers:
Better entry timing
Improved stop placement
Higher probability breakout trades
Blind trading often results in buying resistance or selling support.
Why This Calculator Is Useful for Intraday Trading
Intraday traders benefit because:
Helps identify range-bound markets
Supports breakout timing
Improves reversal trade planning
Reduces overtrading
Strong intraday moves often begin after channel breakouts.
Using Price Channel for Futures Traders
Futures traders benefit since:
Leverage magnifies breakouts
Channels define risk boundaries
Improves long vs short bias
Helps avoid mid-range entries
Weak channel position suggests reduced exposure.
Using Price Channel with Other Indicators
For better accuracy, combine channel analysis with:
Trend direction
VWAP
Volume analysis
Risk-reward planning
Channel defines structure; indicators confirm momentum.
Common Mistakes Traders Make
Many traders:
Buy near resistance
Sell near support
Trade inside mid-range
Ignore breakout confirmation
This calculator helps prevent these errors.
Who Should Use This Price Channel Calculator?
This tool is ideal for:
Intraday traders
Futures traders
Swing traders
Breakout traders
Range traders
Benefits of Using Price Channels
Better trade location
Improved breakout accuracy
Reduced emotional decisions
Stronger risk control
Higher consistency
Channel awareness improves professional decision-making.
Best Practices
Trade breakouts only after confirmation
Avoid mid-channel entries
Use stop losses outside channel
Combine with risk management
Related Calculators
Market Structure Break Calculator
Price Channel Calculator
This tool helps traders evaluate price location within a trading range to improve trade planning and risk control.
Disclaimer: This Price Channel Calculator is for educational purposes only and does not provide trading or investment advice.