Free Multi-Timeframe Trend calculator for Indian traders.
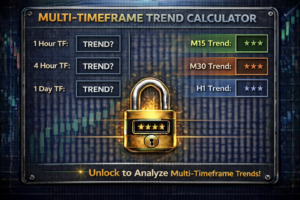
Multi-Timeframe Trend Calculator
Free Equity Trend Finder
Multi-Timeframe Trend Calculator in India
The Multi-Timeframe Trend Calculator helps traders analyze trend alignment across different timeframes before entering a trade. Many traders focus only on one chart timeframe, such as 5-minute or 15-minute charts, and ignore the higher timeframe direction. This often leads to entering trades against the broader market trend. Understanding multi-timeframe alignment improves probability, trade confidence, and risk control.
In the Indian stock market, especially in intraday and futures trading, higher timeframe direction often dominates price behavior. When lower timeframe trades align with higher timeframe trend, the chances of success increase significantly. This calculator simplifies that alignment analysis.
What is Multi-Timeframe Analysis?
Multi-timeframe analysis means studying price action across at least two different timeframes to determine overall market direction.
Higher Timeframe – Defines primary trend (e.g., Daily or 1-Hour chart)
Lower Timeframe – Defines entry timing (e.g., 5-min or 15-min chart)
Professional traders always start from the higher timeframe and then refine entries on lower charts.
Why Multi-Timeframe Trend Matters for Indian Traders
Indian markets often show short-term pullbacks within larger trends. When traders ignore the higher timeframe:
They trade against dominant momentum
Stop losses increase
Confidence drops
When timeframes align:
Trend continuation probability improves
Pullback entries become stronger
Breakouts become more reliable
Risk-reward improves
Alignment reduces random trading decisions.
How the Multi-Timeframe Trend Calculator Works
This calculator uses:
Higher timeframe trend (Bullish, Bearish, Sideways)
Lower timeframe trend (Bullish, Bearish, Sideways)
Logic:
If both timeframes show same direction → Strong alignment
If timeframes conflict → Lower probability
If both sideways → Avoid trading
This creates a simple but powerful trade filter.
Alignment Trading vs Single-Timeframe Trading
Single-timeframe trading ignores broader context. Alignment trading respects market structure.
Alignment trading offers:
Higher probability setups
Improved trade holding
Better risk control
Reduced emotional trading
Single-timeframe trading often results in quick reversals.
Why This Calculator Is Useful for Intraday Trading
Intraday traders benefit because:
Lower timeframe noise reduces
Higher timeframe direction filters trades
Helps avoid counter-trend scalping
Improves breakout accuracy
Strong trend days often show alignment across charts.
Using Multi-Timeframe Alignment for Futures Traders
Futures traders benefit greatly since:
Leverage increases directional impact
Higher timeframe momentum dominates
Improves bias selection
Reduces unnecessary trades
When higher timeframe is bullish and lower timeframe confirms, long trades have stronger probability.
Using Multi-Timeframe Trend with Other Indicators
For better accuracy, combine alignment with:
VWAP
Support and resistance
Volume expansion
Risk-reward planning
Timeframe alignment defines direction, while indicators refine entries.
Common Mistakes Traders Make
Many traders:
Trade lower timeframe reversals against strong higher timeframe trends
Ignore daily trend bias
Overtrade during sideways conditions
Increase position size without alignment
This calculator helps avoid these errors.
Who Should Use This Multi-Timeframe Trend Calculator?
This tool is ideal for:
Intraday traders
Futures traders
Swing traders
Momentum traders
Trend-following traders
Benefits of Multi-Timeframe Alignment
Better trend clarity
Higher probability trades
Reduced emotional decisions
Improved trade management
Stronger consistency
Timeframe alignment is a professional trading principle.
Best Practices
Always analyze higher timeframe first
Trade in direction of dominant trend
Avoid counter-trend trades
Combine with proper risk management
Related Calculators
Multi-Timeframe Trend Calculator
This tool helps traders align higher and lower timeframe trends to improve trade probability and reduce counter-trend risk.
Disclaimer: This Multi-Timeframe Trend Calculator is for educational purposes only and does not provide trading or investment advice.