Free Bollinger Band Breakout calculator for Indian traders.
Bollinger Band Breakout Calculator
Free NSE Trend Finder
Bollinger Band Breakout Calculator in India
The Bollinger Band Breakout Calculator is an advanced volatility expansion tool designed to detect structural breakouts beyond statistically defined price boundaries. Developed from John Bollinger’s volatility framework, Bollinger Bands combine moving averages with standard deviation to measure dynamic price envelopes. Therefore, breakouts beyond these bands often signal volatility regime shifts.
In the Indian stock market, especially during high-momentum phases in indices and futures, volatility compression frequently precedes expansion. Consequently, understanding band breakout dynamics can significantly improve directional trade timing.
Understanding Bollinger Bands
Bollinger Bands consist of:
Middle Band → 20-period moving average
Upper Band → Moving Average + (2 × Standard Deviation)
Lower Band → Moving Average − (2 × Standard Deviation)
The bands expand during high volatility and contract during low volatility. Thus, they adapt to changing market conditions.
Why Breakouts Matter
When price moves beyond the upper or lower band:
Volatility expands
Momentum strengthens
Market regime shifts
However, not every band touch signals a breakout. Therefore, context and expansion strength must be evaluated.
How the Bollinger Band Breakout Calculator Works
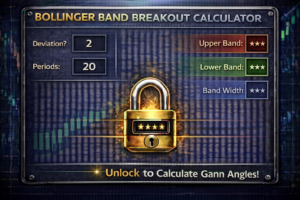
This calculator uses:
Current price
20-period moving average
Standard deviation
Step 1: Calculate upper and lower bands
Step 2: Compare current price against bands
Step 3: Identify breakout condition
If price exceeds upper band → bullish expansion
If price breaks below lower band → bearish expansion
Thus, breakout confirmation becomes data-driven.
Volatility Compression and Expansion
Professional traders often monitor Bollinger Band “squeeze” conditions.
During compression:
Bands narrow
Volatility declines
Energy builds
When expansion occurs:
Bands widen
Directional movement accelerates
Momentum increases
Therefore, breakout analysis becomes crucial after squeeze phases.
Bollinger Bands vs Fixed Price Levels
Traditional support and resistance levels remain static. In contrast, Bollinger Bands adjust dynamically.
Static levels reflect past structure.
Bands reflect statistical volatility.
Consequently, band breakouts often signal regime change rather than simple level breach.
Professional Trading Application
For institutional-grade usage:
Confirm breakout with volume expansion
Combine with trend strength indicators
Avoid counter-trend breakout entries
Watch for band expansion after squeeze
Additionally, combine with trend continuation tools for stronger probability alignment.
Common Mistakes
Many traders:
Short immediately at upper band
Buy immediately at lower band
Ignore volatility context
Trade breakouts during sideways markets
However, band breakouts require confirmation and momentum context.
Who Should Use This Calculator?
This tool is ideal for:
Momentum traders
Volatility traders
Intraday index traders
Futures traders
Trend-following traders
Because volatility analysis requires contextual awareness, it suits intermediate to advanced traders.
Best Practices
Use 20-period moving average standard setting
Monitor volatility contraction before breakout
Avoid overtrading in narrow band conditions
Respect broader trend direction
Professional traders treat volatility expansion as opportunity, not noise.
Related Calculators
Conclusion
The Bollinger Band Breakout Calculator provides a structured way to detect volatility-driven breakout conditions. By integrating statistical envelopes with price comparison logic, traders gain insight into expansion phases. Ultimately, volatility regime recognition enhances precision in momentum trading.
Disclaimer: This Bollinger Band Breakout Calculator is for educational purposes only and does not provide trading or investment advice.