Free ADX Trend Strength calculator for Indian traders.
ADX Trend Strength Calculator
Free NSE Trend Finder
ADX Trend Strength Calculator in India
The ADX Trend Strength Calculator is a directional movement analysis tool designed to measure trend intensity rather than direction alone. Developed by J. Welles Wilder, the Average Directional Index (ADX) quantifies whether a market is trending or ranging. Therefore, it helps traders avoid trading breakouts during weak conditions and identify high-momentum phases with precision.
In the Indian stock market, especially in index futures and momentum-driven stocks, trend strength fluctuates rapidly. Consequently, distinguishing between developing and strong trends becomes critical for professional trade execution.
Understanding the ADX Indicator
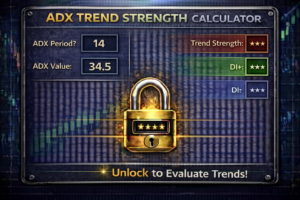
The ADX indicator consists of three components:
ADX Line → Measures overall trend strength
+DI (Positive Directional Indicator) → Measures bullish pressure
–DI (Negative Directional Indicator) → Measures bearish pressure
While +DI and –DI determine direction, ADX determines strength. As a result, ADX does not indicate bullish or bearish bias independently; it only measures momentum intensity.
Interpreting ADX Values
Professional traders typically use these levels:
Below 20 → Weak trend or range market
20–25 → Emerging trend
Above 25 → Strong trend environment
Above 40 → Extremely strong momentum
Therefore, ADX above 25 often confirms breakout validity. Conversely, ADX below 20 suggests range-bound conditions.
How the ADX Trend Strength Calculator Works
This calculator uses:
Current ADX value
+DI value
–DI value
First, it categorizes trend strength based on ADX level. Next, it determines directional bias by comparing +DI and –DI values. As a result, traders gain both strength and direction insight simultaneously.
For example:
ADX = 28
+DI = 30
–DI = 18
This indicates strong bullish trend.
ADX vs Moving Averages
Moving averages identify direction but lag price. In contrast, ADX measures strength without directional bias.
Moving averages react to price history.
ADX evaluates trend momentum intensity.
Therefore, combining ADX with structure-based entries improves breakout reliability.
Why ADX Matters for Indian Traders
Indian markets frequently shift between range and trend sessions. Without strength confirmation:
Breakout trades may fail
False signals increase
Overtrading occurs
However, when ADX confirms strength:
Trend continuation probability rises
Pullback entries become safer
Momentum trading improves
Consequently, ADX acts as a trend filter rather than entry trigger.
Professional Application Strategy
For institutional-level application:
Enter breakout trades only when ADX > 25
Avoid aggressive entries when ADX < 20
Confirm directional bias with +DI / –DI crossover
Combine with volatility expansion tools
Additionally, multi-timeframe ADX alignment increases reliability.
Common Mistakes
Many traders misuse ADX by:
Trading solely based on +DI crossover
Ignoring ADX slope
Entering during low-strength environment
Using ADX without structure confirmation
However, ADX should confirm, not replace, structural analysis.
Who Should Use This Calculator?
This tool is ideal for:
Intraday traders
Index futures traders
Momentum traders
Breakout traders
Trend-following swing traders
Because it filters weak conditions, it benefits both beginners and advanced traders.
Combining ADX with Other Tools
For stronger probability alignment, combine ADX with:
Breakout Confirmation Calculator
Bollinger Band Breakout Calculator
Conclusion
The ADX Trend Strength Calculator provides a structured framework to measure market momentum intensity and directional bias. By separating strength from direction, it helps traders filter low-probability trades and focus on high-momentum environments. Ultimately, ADX integration enhances professional trade selection and execution discipline.
Disclaimer: This ADX Trend Strength Calculator is for educational purposes only and does not provide trading or investment advice.