Free Head & Shoulders Pattern Calculator for stock market
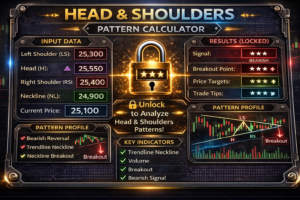
Head & Shoulders Pattern Calculator
Free BSE Trend Finder
Free Head & Shoulders Pattern Calculator in India
The Head & Shoulders Pattern Calculator is a classical chart pattern projection tool designed to estimate breakout targets based on structural reversal geometry. Unlike indicator-based systems, this pattern relies purely on price structure and crowd psychology. Therefore, it remains one of the most reliable reversal formations in technical analysis.
In the Indian stock market, especially in trending phases of Nifty, Bank Nifty, and large-cap stocks, head and shoulders formations frequently appear near exhaustion zones. Consequently, calculating target projections accurately improves strategic planning.
Understanding the Head & Shoulders Pattern
The Head & Shoulders pattern consists of three peaks:
Left Shoulder
Head (highest peak)
Right Shoulder
The neckline connects the swing lows between shoulders. When price breaks below the neckline, the pattern confirms a bearish reversal.
Conversely, in an Inverse Head & Shoulders pattern, the structure signals bullish reversal.
Because this formation reflects distribution or accumulation phases, it often precedes strong directional moves.
Why Head & Shoulders is Highly Reliable
The pattern works due to psychological transition:
Uptrend weakens
Buying pressure declines
Distribution increases
Neckline breaks
As a result, the breakdown represents a structural shift in supply-demand dynamics.
Unlike oscillators, this pattern reflects actual market behavior.
How the Head & Shoulders Calculator Works
This calculator uses:
Head price
Neckline price
Breakout direction
First, it measures pattern height:
Height = Head − Neckline
Next, it projects target equal to pattern height from neckline breakout.
For example:
Head = ₹1200
Neckline = ₹1150
Height = ₹50
Bearish target = ₹1150 − ₹50 = ₹1100
Thus, projection is based on measurable structure.
Inverse Head & Shoulders Pattern
In bullish setups:
Pattern forms after downtrend
Head is lowest point
Neckline breakout confirms reversal
Target is calculated by adding height to neckline.
Therefore, both bullish and bearish scenarios can be measured objectively.
Head & Shoulders vs Indicator Signals
Indicators lag price because they use historical data. In contrast, head and shoulders formation emerges from price structure itself.
Indicators confirm momentum.
Patterns reveal structural transition.
Consequently, combining pattern projection with trend strength confirmation enhances probability.
Professional Trading Application
For advanced usage:
Confirm volume expansion on neckline break
Avoid early entries before confirmation
Combine with multi-timeframe trend alignment
Use measured move as minimum target
Additionally, monitor false breakout risk in range-bound markets.
Common Mistakes Traders Make
Many traders:
Enter before neckline break
Ignore pattern symmetry
Overestimate target potential
Trade incomplete formations
However, patience and confirmation significantly improve success rate.
Who Should Use This Calculator?
This tool is ideal for:
Swing traders
Position traders
Intraday breakout traders
Index futures traders
Technical pattern traders
Because it relies on pure structure, it suits traders of all experience levels.
Related Calculators
Market Structure Break Calculator
The Market Structure Break Calculator helps confirm whether neckline breaks align with broader structural shifts, improving reversal reliability.
Disclaimer
This Head & Shoulders Pattern Calculator is for educational purposes only and does not provide trading or investment advice.