What is Market Volatility Calculator
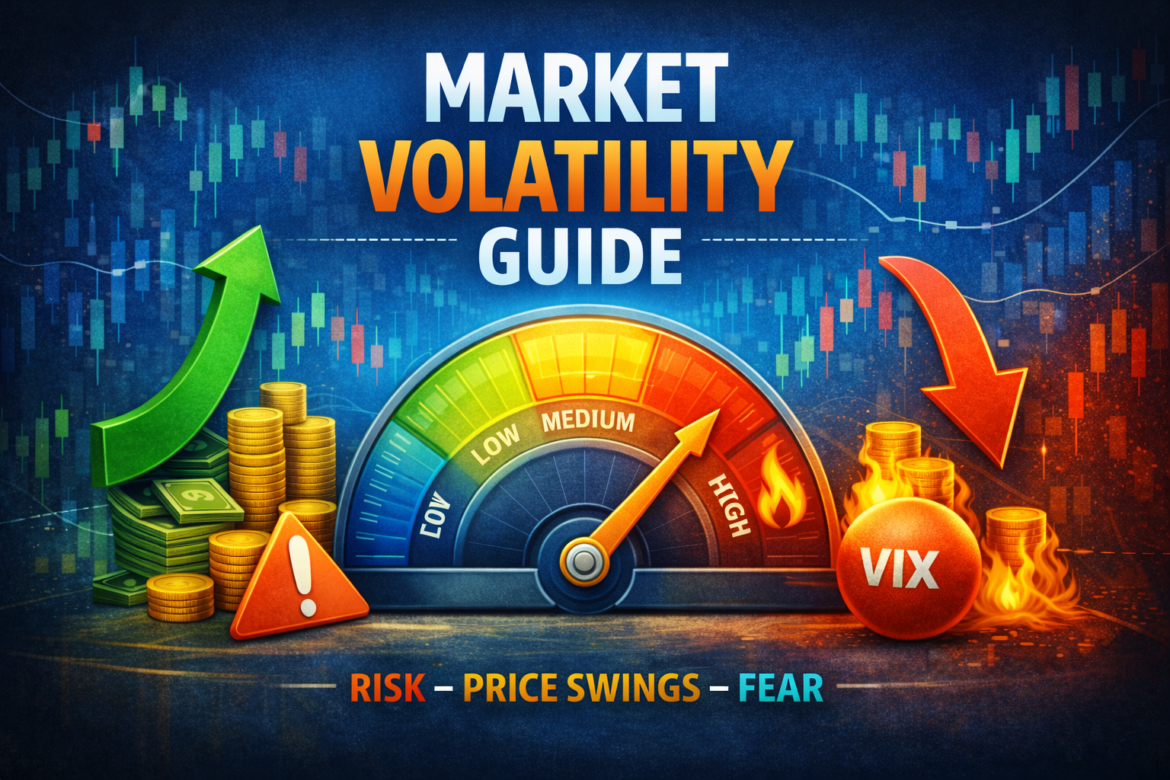
Market volatility refers to the speed and magnitude of price movements in a financial market. In simple terms, volatility measures how much the price of a stock, index, or asset moves within a certain period of time.
In intraday trading, volatility is extremely important because it determines how much profit or loss a trader can potentially experience in a single trading session.
When volatility is high, prices move rapidly and large price swings occur. This creates opportunities for traders to capture larger profits. However, it also increases the risk because price movements can be unpredictable.
On the other hand, when volatility is low, price movements are smaller and the market tends to move sideways. In such conditions traders may find fewer opportunities.
Understanding volatility helps traders adjust their trading strategies. For example, traders may use wider stop losses in high volatility markets and tighter stops in low volatility markets.
Professional traders often analyze volatility before entering trades. They want to know whether the market has enough movement to justify taking a trade.
Several indicators and tools help traders measure volatility, including ATR, standard deviation, and average daily range.
Instead of calculating volatility manually, traders often use automated tools that measure price movement quickly and accurately.
To determine appropriate stop loss levels based on volatility, traders often rely on ATR Stop Loss Calculator.
Why Volatility Is Important in Trading
Volatility plays a critical role in trading decisions. It influences risk management, position sizing, and trade timing.
There are several reasons why volatility analysis is important.
Trade Opportunities
Higher volatility means larger price movements. This increases the potential for profit opportunities in intraday trading.
Risk Management
Volatility helps traders determine appropriate stop loss levels. When volatility increases, traders may need to widen their stop loss to avoid getting stopped out prematurely.
Strategy Selection
Certain trading strategies perform better under specific volatility conditions. For example, breakout strategies often work best in high volatility environments.
By analyzing volatility levels, traders can select the most appropriate trading strategy for current market conditions.
Instead of estimating volatility manually, many traders use Volatility Percentage Calculator to measure price movement relative to the average price.
Top 10 Volatility Trading Tools
Below are useful tools that help traders analyze market volatility and plan trades more effectively.
-
ATR Stop Loss Calculator
-
ATR Target Calculator
-
ADR (Average Daily Range) Calculator
-
Volatility Percentage Calculator
-
Standard Deviation Calculator
-
Volatility Stop Calculator
-
Intraday Volatility Range Calculator
-
Expected Move Calculator
-
Gap Trading Risk Calculator
-
Intraday Gap Fill Probability
These tools help traders measure price movement and improve trading decisions.
1. ATR Stop Loss Calculator
Average True Range (ATR) is a popular indicator used to measure market volatility. ATR calculates the average range between high and low prices over a specific number of periods.
Traders often use ATR to determine appropriate stop loss levels. Instead of placing stop losses randomly, traders adjust them based on the current volatility of the market.
For example, if the ATR value of a stock is ₹10, it means the price typically moves about ₹10 during a trading period.
A trader may place a stop loss at 1× ATR or 2× ATR depending on their strategy.
Example:
Entry price = ₹500
ATR value = ₹10
Stop loss (1 ATR):
₹500 − ₹10 = ₹490
This approach helps traders avoid placing stop losses too close to the entry price.
Manual calculations can be slow during fast markets.
To simplify the process, traders often use ATR Stop Loss Calculator.
2. ATR Target Calculator
Just as ATR can be used to determine stop losses, it can also help traders set realistic profit targets.
ATR target calculations estimate how far price may move based on current volatility levels.
For example:
ATR value = ₹12
Entry price = ₹400
Target (2 ATR):
₹400 + ₹24 = ₹424
Using ATR targets allows traders to set profit targets that align with normal market movement.
Setting targets too far away may cause traders to miss profit opportunities.
Setting targets too close may limit potential gains.
To determine appropriate profit targets based on volatility, traders use ATR Target Calculator.
3. ADR Calculator
Average Daily Range (ADR) measures the average difference between the daily high and daily low of a stock.
ADR helps traders estimate how far a stock usually moves during a single trading day.
For example:
If a stock has an ADR of ₹15, it means the stock typically moves about ₹15 between its daily high and low.
If the stock has already moved ₹14 during the day, there may be limited room for additional movement.
ADR analysis helps traders avoid entering trades when most of the daily movement has already occurred.
Instead of calculating this manually, traders often use ADR Calculator to measure average daily range quickly.
4. Volatility Percentage Calculator
Volatility percentage measures how much a stock moves relative to its price.
This metric helps traders compare volatility across different stocks.
Example:
Stock price = ₹200
Daily movement = ₹10
Volatility percentage:
(10 ÷ 200) × 100 = 5%
Higher volatility percentage indicates larger price movements.
Lower volatility percentage suggests a more stable market.
To calculate volatility relative to price levels, traders use Volatility Percentage Calculator.
5. Standard Deviation Calculator
Standard deviation is a statistical tool used to measure how much price deviates from its average value.
In trading, standard deviation is commonly used to analyze market volatility.
Higher standard deviation values indicate larger price fluctuations.
Lower standard deviation values suggest stable market conditions.
Indicators like Bollinger Bands use standard deviation to measure volatility and adjust price bands.
Instead of performing statistical calculations manually, traders often use Standard Deviation Calculator.
6. Volatility Stop Calculator
Volatility stops are dynamic stop loss levels that adjust based on market volatility.
Unlike fixed stop losses, volatility stops change as market conditions change.
For example:
When volatility increases, stop loss levels may widen.
When volatility decreases, stop loss levels may tighten.
This method allows traders to stay in trending trades longer.
To determine dynamic stop loss levels based on volatility, traders often use Volatility Stop Calculator.
7. Intraday Volatility Range Calculator
Intraday volatility range measures how far price moves during a single trading session.
This metric helps traders identify stocks that are actively moving during the day.
Stocks with higher intraday volatility often provide better trading opportunities.
However, higher volatility also means higher risk.
Traders analyze volatility range before selecting stocks for intraday trading.
To measure this quickly, traders often use Intraday Volatility Range Calculator.
8. Expected Move Calculator
Expected move estimates how far the price of an asset may move during a specific period.
This concept is often used in options trading but is also useful for stock traders.
Expected move calculations help traders set realistic price targets and stop loss levels.
For example:
If the expected move for a stock is ₹20, traders may plan their trades within that range.
To estimate price movement potential, traders often use Expected Move Calculator.
9. Gap Trading Risk Calculator
Price gaps occur when a stock opens significantly higher or lower than the previous day’s closing price.
Gaps are often caused by news events, earnings announcements, or market sentiment changes.
While gap trading can provide opportunities, it also carries significant risk.
Traders must evaluate the risk associated with gap movements before entering trades.
To analyze this risk quickly, traders use Gap Trading Risk Calculator.
10. Intraday Gap Fill Probability
Many traders believe that price gaps tend to fill during the trading session.
Gap fill probability estimates the likelihood that a price gap will close during the day.
Understanding gap behavior helps traders plan gap trading strategies.
However, not all gaps get filled. Some gaps lead to strong trending moves.
To estimate the probability of gap fills, traders often use Intraday Gap Fill Probability.
FAQ
What is volatility in trading?
Volatility measures how much the price of an asset moves within a specific period.
Why is volatility important for traders?
Volatility determines potential profit opportunities and risk levels in trading.
How do traders measure volatility?
Traders use indicators such as ATR, standard deviation, and average daily range.
Is high volatility good for trading?
High volatility creates more opportunities but also increases risk.
Which indicators measure volatility?
ATR, Bollinger Bands, and standard deviation are commonly used volatility indicators.
Conclusion
Volatility analysis is a critical part of successful trading. Understanding how much a stock typically moves helps traders make better decisions about entries, stop losses, and profit targets.
High volatility markets provide greater trading opportunities, but they also increase risk. Traders must adjust their strategies according to current market conditions.
By analyzing volatility levels using tools such as ATR, standard deviation, and average daily range, traders can better understand market behavior and plan trades more effectively.
Tools like ATR Stop Loss Calculator, ADR Calculator, and Expected Move Calculator help traders measure price movement and set realistic targets based on market volatility.
Using these tools along with proper risk management can significantly improve trading discipline and long-term consistency.
For additional learning resources on volatility indicators and trading strategies, traders can explore educational guides available on Investopedia and other financial education platforms.