Advanced Trading Metrics Guide
What are Advanced Trading Metrics
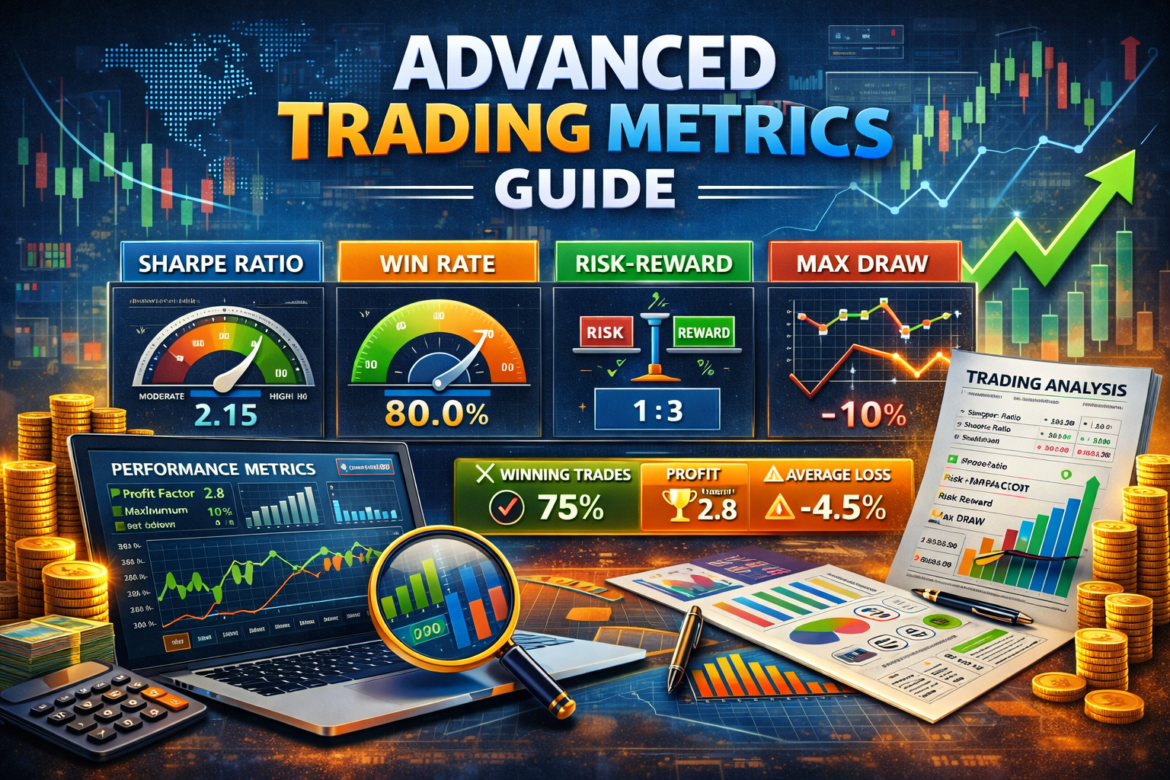
Advanced trading metrics are detailed calculations that help traders understand their performance, risk exposure, and decision-making process at a deeper level.
While many beginners focus only on profit and loss, experienced traders know that long-term success depends on consistency, discipline, and controlled risk.
For example, two traders may earn the same profit. However, one trader may take excessive risk while the other follows a structured plan. In such cases, advanced metrics help identify which trader is more sustainable.
Moreover, these metrics provide clarity. Instead of guessing performance, traders rely on data.
In addition, advanced metrics help in identifying hidden problems such as overtrading, inconsistent position sizing, and poor risk control.
Because of this, professional traders use these tools regularly to refine their strategies.
To estimate market movement and improve decision-making, traders often use Expected Move Calculator.
Why Advanced Metrics Matter in Trading
Advanced metrics play a critical role in improving trading performance.
First, they provide objective analysis. Traders can evaluate their performance without emotional bias.
Second, they highlight weaknesses. For example, high drawdown or inconsistent results indicate problems in strategy.
In addition, advanced metrics improve risk management. Traders can adjust their risk based on data.
Moreover, these metrics help in maintaining discipline. By tracking behavior, traders can avoid emotional mistakes.
For example, a trader may realize that overtrading reduces profitability.
Therefore, using advanced metrics leads to better decisions.
To adjust stop loss dynamically based on market conditions, traders often use Volatility Stop Calculator.
Key Areas Covered by Advanced Metrics
Advanced trading metrics cover several important areas.
Performance Analysis
This includes measuring profitability, consistency, and efficiency.
Risk Management
This focuses on controlling losses and maintaining capital.
Behavioral Analysis
This helps identify emotional mistakes and discipline issues.
Market Analysis
This includes understanding volatility and price movement.
Each of these areas contributes to long-term success.
For example, a trader may have good strategy but poor discipline.
Therefore, combining all metrics gives a complete picture.
To analyze price movement effectively, traders often use Intraday Volatility Range Calculator.
Top 10 Advanced Trading Tools
-
Trading Streak Impact Calculator
-
Intraday Gap Fill Probability
-
Gap Trading Risk Calculator
-
Volatility Stop Calculator
-
Intraday Volatility Range Calculator
-
High–Low Range Calculator
-
Expected Move Calculator
-
Position Sizing Consistency
-
Trading Recovery Percentage
-
Intraday Capital Allocation
1.Trading Streak Impact Calculator
Trading streaks refer to consecutive winning or losing trades.
Winning streaks can increase confidence. However, they may also lead to overconfidence.
On the other hand, losing streaks can create fear and hesitation.
For example:
After multiple losses, traders may avoid taking valid trades.
Similarly, after winning trades, traders may increase position size unnecessarily.
Therefore, understanding streak behavior is essential.
Additionally, streaks affect emotional stability. Traders may deviate from their strategy.
Instead of reacting emotionally, traders should analyze data.
To measure how streaks affect performance and behavior, traders often use Trading Streak Impact Calculator.
2.Intraday Gap Fill Probability
Gap fill probability measures the likelihood that a price gap will close during the trading session.
Gaps occur due to overnight news or global market movements.
For example:
If a stock opens higher than the previous close, it creates a gap-up.
Some gaps get filled quickly, while others lead to strong trends.
Understanding this helps traders decide whether to trade reversals or follow the trend.
Additionally, gap behavior varies based on market conditions.
Therefore, traders should analyze probability before entering trades.
To estimate the likelihood of gap fill, traders often use Intraday Gap Fill Probability.
3.Gap Trading Risk Calculator
Gap trading offers high potential but also high risk.
Large gaps create volatility and unpredictable price movements.
For example:
A gap-up may reverse suddenly, causing losses.
Therefore, traders must evaluate risk before entering gap trades.
Additionally, gap trades require quick decisions.
Without proper analysis, traders may enter at the wrong time.
Professional traders always calculate risk before trading gaps.
To analyze potential losses and risk exposure, traders often use Gap Trading Risk Calculator.
4.Volatility Stop Calculator
Volatility stop is a dynamic method of placing stop loss.
Instead of using fixed levels, traders adjust stop loss based on market volatility.
For example:
In high volatility, stop loss should be wider.
In low volatility, stop loss can be tighter.
This approach helps traders avoid premature exits.
Additionally, it improves trade management.
However, calculating volatility-based stop manually is difficult.
Therefore, traders use automated tools.
To calculate dynamic stop loss levels accurately, traders often use Volatility Stop Calculator.
5.Intraday Volatility Range Calculator
Intraday volatility range measures how much price moves during the day.
High volatility means larger price movements.
Low volatility indicates limited movement.
Traders use this information to select stocks for trading.
For example:
High volatility stocks offer more opportunities.
However, they also carry higher risk.
Therefore, understanding volatility helps traders choose the right trades.
To measure daily price movement accurately, traders often use Intraday Volatility Range Calculator.
6.High–Low Range Calculator
High–low range measures the difference between the highest and lowest price.
This metric helps traders understand price fluctuation.
For example:
A large range indicates strong movement.
A small range indicates consolidation.
Traders use this information to plan entries and exits.
Additionally, it helps in identifying breakout opportunities.
To calculate range quickly and accurately, traders often use High–Low Range Calculator.
7.Expected Move Calculator
Expected move estimates how far price may move during a specific period.
This helps traders set realistic targets and stop loss.
For example:
If expected move is ₹20, traders plan trades within that range.
Additionally, it helps avoid unrealistic expectations.
Instead of guessing price movement, traders rely on data.
To estimate potential movement accurately, traders often use Expected Move Calculator.
8.Position Sizing Consistency
Consistency in position sizing is essential for long-term success.
Many traders change position size based on emotions.
For example:
After losses, they increase size to recover quickly.
After wins, they take bigger risks.
This leads to inconsistent results.
Professional traders maintain fixed risk per trade.
This ensures stability and discipline.
To maintain consistent position sizing, traders often use Position Sizing Consistency.
9.Trading Recovery Percentage
Recovery percentage shows how much gain is needed after a loss.
For example:
A 50% loss requires 100% gain to recover.
This highlights the importance of risk management.
Large losses make recovery difficult.
Therefore, traders should focus on minimizing losses.
Additionally, understanding recovery helps traders stay disciplined.
To calculate recovery requirements, traders often use Trading Recovery Percentage.
10.Intraday Capital Allocation
Capital allocation determines how traders distribute funds across trades.
Proper allocation reduces risk and improves stability.
For example:
Instead of investing all capital in one trade, traders divide it.
This reduces the impact of losses.
Additionally, it allows diversification.
Professional traders follow strict allocation rules.
To manage capital effectively, traders often use Intraday Capital Allocation.
FAQ
What are advanced trading metrics?
They help analyze performance, risk, and behavior.
Why are they important?
They improve consistency and decision-making.
Can beginners use them?
Yes, they help avoid mistakes early.
Conclusion
Advanced trading metrics provide deeper insights into trading performance.
They help traders understand risk, improve discipline, and enhance consistency.
By using tools like Expected Move Calculator and Volatility Stop Calculator, traders can make better decisions.
Moreover, combining these metrics with proper risk management leads to long-term success.
For additional learning, traders can explore Investopedia.