Free Ichimoku Cloud Calculator to analyze trend direction, momentum strength and dynamic support resistance levels.
Ichimoku Cloud Calculator
Free BSE Trend Finder
Free Ichimoku Cloud Calculator in India
The Ichimoku Cloud Calculator helps traders analyze trend direction, momentum, and potential support or resistance zones using structured Ichimoku logic. Many traders view Ichimoku as a complicated indicator. However, when broken into components, it becomes a complete trading system.
Unlike single-line indicators, Ichimoku provides multi-layered confirmation. Therefore, it allows traders to evaluate trend strength and market structure simultaneously.
What Is Ichimoku Cloud?
Ichimoku Kinko Hyo is a Japanese trend-following system designed to provide a “one glance equilibrium” view of the market. Instead of relying on separate tools, it combines trend, momentum, and support-resistance into one framework.
The five components include:
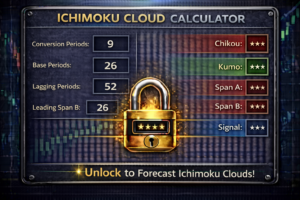
Tenkan-sen (Conversion Line)
Kijun-sen (Base Line)
Senkou Span A
Senkou Span B
Chikou Span
Although it appears complex, each component serves a logical purpose.
Understanding Tenkan-sen and Kijun-sen
The Tenkan-sen represents short-term momentum. Meanwhile, the Kijun-sen reflects medium-term balance.
When Tenkan crosses above Kijun, bullish momentum strengthens. Conversely, when Tenkan crosses below Kijun, bearish momentum increases.
However, crossovers alone are not enough. Therefore, cloud position must also be considered.
What Is the Ichimoku Cloud?
The cloud, formed by Senkou Span A and B, represents projected support and resistance.
When price trades above the cloud, trend bias is bullish. On the other hand, when price trades below the cloud, bearish pressure dominates.
If price remains inside the cloud, the market is consolidating.
Thus, cloud structure acts as a trend filter.
Why Ichimoku Works in Indian Markets
In indices like Nifty and Bank Nifty, trend clarity is essential. Since volatility expands during sessions, multi-layer confirmation improves probability.
Moreover, Ichimoku helps traders avoid false breakouts. Because the cloud acts as dynamic support and resistance, it filters weak signals.
Consequently, disciplined traders rely on cloud positioning before entering trades.
How This Ichimoku Cloud Calculator Works
This calculator focuses on key structural relationships.
If Price > Tenkan > Kijun → Strong bullish structure.
If Price < Tenkan < Kijun → Strong bearish structure.
Otherwise → Neutral consolidation.
Although simplified, this logic captures the core momentum hierarchy.
Ichimoku Trend Confirmation Strategy
First, identify whether price is above or below the cloud.
Next, confirm Tenkan and Kijun alignment.
Then, check for higher timeframe trend support.
Finally, manage risk accordingly.
Because Ichimoku combines structure and momentum, it reduces overtrading.
Common Mistakes Traders Make
Many traders:
Ignore cloud position
Trade crossovers inside consolidation
Use Ichimoku without trend context
Overleverage during ranging markets
Therefore, combining structure and discipline improves consistency.
Benefits of Using Ichimoku Cloud Calculator
Quick trend bias detection
Clear bullish or bearish hierarchy
Reduced emotional decisions
Structured multi-layer confirmation
Although no indicator guarantees profit, structured systems increase probability.
Best Practices
Confirm higher timeframe trend first.
Avoid trading inside thick cloud zones.
Use stop loss beyond cloud boundaries.
Maintain consistent risk percentage.
Professional trading depends on execution, not prediction.
Related Calculators
The ADX Trend Strength Calculator helps traders measure whether a trend has strong momentum. Combining ADX with Ichimoku improves trend reliability and reduces false entries.
Disclaimer
This Ichimoku Cloud Calculator is for educational purposes only and does not provide trading or investment advice.