Free Keltner Channel Calculator to measure volatility-based price expansion using EMA and ATR.
Keltner Channel Calculator
Free BSE Trend Finder
Free Keltner Channel Calculator in India
The Keltner Channel Calculator helps traders measure volatility-based price expansion around an exponential moving average. While many traders rely on static support and resistance, professional traders often use volatility-adjusted channels. Therefore, Keltner Channels provide a dynamic method for identifying overextension and breakout strength.
Unlike Donchian Channels, which focus purely on price extremes, Keltner Channels incorporate Average True Range (ATR). Consequently, they adapt to changing volatility conditions.
What Is a Keltner Channel?
A Keltner Channel consists of:
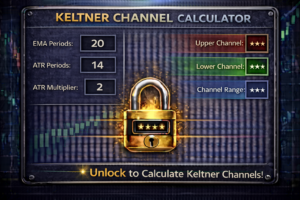
Middle Line = Exponential Moving Average (EMA)
Upper Band = EMA + (ATR × Multiplier)
Lower Band = EMA − (ATR × Multiplier)
Typically, the multiplier is set to 2. Because ATR measures volatility, the channel expands and contracts based on market conditions.
Thus, Keltner Channels adjust automatically to volatility shifts.
Why Keltner Channels Matter
Markets move in cycles of compression and expansion. During low volatility, price remains near the middle band. However, during expansion phases, price often touches or exceeds outer bands.
Therefore, traders use Keltner Channels to identify:
Strong trending conditions
Volatility breakouts
Overextended price zones
Pullback opportunities
Because the system adjusts dynamically, it reduces static-level bias.
How This Keltner Channel Calculator Works
This calculator requires:
EMA value
ATR value
Current price
First, it calculates the upper and lower channel boundaries. Next, it determines whether price is inside the channel or breaking beyond it.
If price moves above the upper band, bullish volatility expansion occurs. Conversely, if price drops below the lower band, bearish expansion dominates.
If price remains within bands, volatility stays normal.
Although the logic is simple, interpretation requires discipline.
Keltner Channel vs Donchian Channel
Both tools measure volatility differently.
Donchian uses highest high and lowest low.
Keltner uses ATR and EMA.
Therefore, Donchian identifies breakout levels, while Keltner measures volatility-adjusted expansion.
Professional traders sometimes combine both for confirmation.
Using Keltner Channels for Intraday Trading
Intraday traders monitor volatility shifts carefully. When price closes outside the upper band with strong momentum, continuation probability increases.
However, during range-bound days, price frequently returns inside the channel. Therefore, traders should confirm breakout strength before entering positions.
Moreover, using ATR-based stop loss improves consistency.
Using Keltner Channels for Swing Trading
Swing traders benefit from volatility expansion signals. When daily candles close outside outer bands, multi-day trends may develop.
However, premature entries inside compression phases often lead to whipsaws.
Thus, patience remains critical.
Common Mistakes Traders Make
Entering without candle confirmation
Ignoring overall market trend
Using inconsistent ATR multipliers
Overleveraging during volatility spikes
As a result, risk increases unnecessarily.
Structured risk control improves sustainability.
Benefits of Using This Calculator
Dynamic volatility measurement
Clear expansion signals
Reduced emotional trading
Better risk placement zones
Although no indicator guarantees profit, volatility awareness improves probability.
Best Practices
Confirm expansion with volume.
Align direction with higher timeframe trend.
Avoid overtrading during compression.
Use ATR-based stop losses.
Professional trading depends on structured execution.
Related Calculators
The ATR Stop Loss Calculator helps traders define volatility-adjusted stop levels, improving capital protection during expansion phases.
Disclaimer
This Keltner Channel Calculator is for educational purposes only and does not provide trading or investment advice.