Liquidity Sweep Detector to identify buy-side and sell-side liquidity grabs in the market.
Liquidity Sweep Detector
Free BSE Trend Finder
Free Liquidity Sweep Detector Calculator in India
The Liquidity Sweep Detector helps traders identify stop hunts and liquidity grabs in real time. Many retail traders interpret breakouts as strong directional moves. However, institutional traders often view these moves differently. Instead of chasing price, they analyze where liquidity is resting.
In stock market, price does not move randomly. Rather, it seeks liquidity. Therefore, understanding where stops are placed gives traders a structural advantage. When liquidity is taken, market behavior frequently shifts. As a result, timing entries becomes more strategic.
What Is a Liquidity Sweep?
A liquidity sweep occurs when price moves above a recent swing high or below a recent swing low to trigger stop-loss orders. These stop orders provide liquidity for larger participants.
For example, retail traders typically place stop losses above highs or below lows. Consequently, those areas become liquidity pools. When price briefly breaks those levels and quickly reverses, a sweep has likely occurred.
Although sweeps may appear as breakouts, they often serve a different purpose. Instead of initiating trends, they can signal accumulation or distribution phases.
Buy-Side and Sell-Side Liquidity Explained
Buy-side liquidity exists above previous highs. When price trades above that high, short sellers’ stop losses get triggered. As a result, additional buy orders enter the market.
Sell-side liquidity exists below previous lows. When price drops beneath that level, long traders’ stop losses get activated. Consequently, forced selling creates liquidity for institutional buying.
Therefore, identifying which side has been swept helps traders anticipate potential directional shifts.
Why Liquidity Sweeps Matter in Indian Markets
In Indian indices like Nifty and Bank Nifty, liquidity events occur frequently during market open and major session overlaps. Since volatility expands during these periods, stops cluster more aggressively.
Moreover, institutions require liquidity to execute large orders. Thus, engineered moves toward obvious highs and lows become common. When traders understand this behavior, they stop reacting emotionally to fake breakouts.
Instead of assuming continuation, disciplined traders wait for confirmation. Consequently, decision quality improves significantly.
How the Liquidity Sweep Detector Works
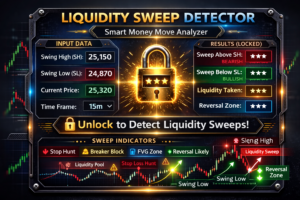
This Liquidity Sweep Detector uses three simple inputs:
Recent Swing High
Recent Swing Low
Current Price
If the current price trades above the recent swing high, buy-side liquidity is considered swept. On the other hand, if price falls below the recent swing low, sell-side liquidity is taken.
However, if price remains within the range, no sweep is detected. This structured approach simplifies complex Smart Money concepts into practical decision support.
Liquidity Sweep vs True Breakout
Many traders confuse liquidity sweeps with genuine breakouts. Although both involve price crossing key levels, their outcomes differ.
A true breakout usually shows strong continuation, increasing volume, and structural follow-through. In contrast, a liquidity sweep often results in sharp rejection and a return inside the prior range.
Therefore, confirmation becomes essential. After a sweep, traders should observe whether structure shifts or momentum fades. This additional step filters low-probability trades.
Smart Money Perspective on Liquidity
Institutional traders operate differently from retail participants. Because they manage larger capital, they require liquidity to enter positions efficiently.
Before reversing a market, institutions may push price into stop clusters. Consequently, weaker hands exit positions prematurely. Once liquidity is absorbed, price may reverse with strength.
Thus, liquidity sweeps frequently precede significant directional moves.
Using Liquidity Sweep with Market Structure
Liquidity detection alone is not enough. Instead, it should be combined with market structure analysis.
For example, after a sell-side sweep, if price forms a higher low and breaks minor resistance, bullish confirmation strengthens. Similarly, after a buy-side sweep, a lower high followed by a breakdown increases bearish probability.
Because confirmation adds confluence, trade quality improves.
Best Timeframes for Liquidity Analysis
Liquidity sweeps appear on multiple timeframes. However, intraday traders often monitor 5-minute and 15-minute charts. Meanwhile, swing traders prefer 1-hour or 4-hour levels.
Higher timeframe sweeps generally produce stronger reactions. Therefore, combining multi-timeframe analysis enhances precision.
Common Mistakes Traders Make
Many traders enter immediately after a level break. However, not every breakout sustains momentum.
Others ignore broader trend direction. Consequently, they trade against higher timeframe bias.
Additionally, some traders overleverage during volatile sweeps. As a result, minor fluctuations trigger unnecessary stop losses.
Discipline and patience remain critical.
Benefits of Using the Liquidity Sweep Detector
This tool simplifies complex liquidity theory into practical signals. Instead of guessing, traders can quickly confirm whether liquidity has been taken.
Moreover, emotional breakout chasing reduces significantly. As clarity increases, risk management becomes easier.
Furthermore, structured liquidity analysis supports both reversal and continuation strategies.
Although no tool guarantees profits, systematic execution improves long-term consistency.
Practical Trading Approach
First, identify recent highs and lows. Next, monitor whether price sweeps those levels. After that, wait for confirmation through structure shift or momentum expansion.
Finally, execute with defined stop loss and risk control.
Because trading success depends on probability rather than prediction, structured confirmation enhances edge.
Who Should Use This Tool?
This Liquidity Sweep Detector is suitable for:
Intraday traders
Index traders
Futures traders
Options traders
Smart Money concept learners
Technical analysts
Since liquidity exists in all markets, the concept remains universally applicable.
Why Structured Liquidity Analysis Improves Discipline
When traders understand liquidity behavior, fear decreases. Instead of reacting impulsively, they analyze objectively.
Consequently, trade selection becomes more selective. Fewer trades often lead to better performance.
Moreover, structured logic reduces overtrading and emotional decision-making.
Professional trading requires consistency. Liquidity awareness strengthens that consistency.
Related Calculators
The Portfolio Risk Calculator helps traders measure cumulative capital exposure across multiple trades. As a result, it improves discipline, reduces unnecessary drawdowns, and supports long-term trading sustainability.
Disclaimer
This Liquidity Sweep Detector is for educational purposes only and does not provide trading or investment advice. Trading in financial markets involves risk, and past performance does not guarantee future results. Always conduct your own research and use proper risk management before making trading decisions.