Free MACD Crossover Signal Calculator.
MACD Crossover Signal Calculator
Free BSE Trend Finder
MACD Crossover Signal Calculator
The MACD Crossover Signal Calculator helps traders quickly identify bullish and bearish momentum shifts using exponential moving averages. Many traders apply the MACD indicator without understanding its structural logic. As a result, they often enter late, exit early, or misinterpret temporary fluctuations as strong signals. Therefore, using a structured crossover calculator improves clarity and decision-making.
In professional trading environments, MACD crossovers represent momentum transitions between short-term and long-term averages. Consequently, they help traders align with emerging directional bias instead of reacting emotionally to price noise.
What Is MACD?
MACD stands for Moving Average Convergence Divergence. It measures the difference between two exponential moving averages (EMAs) and tracks momentum acceleration.
The three components include:
MACD Line = Fast EMA − Slow EMA
Signal Line = EMA of MACD Line
Histogram = MACD − Signal Line
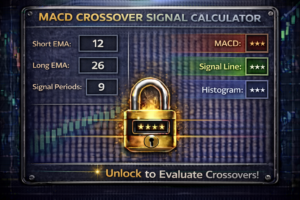
Typically, traders use a 12-period fast EMA, 26-period slow EMA, and 9-period signal line. However, professional traders may adjust parameters depending on volatility and timeframe.
What Is a MACD Crossover?
A MACD crossover occurs when the MACD line crosses above or below the signal line.
When the MACD line crosses above the signal line, bullish momentum begins increasing. Therefore, buying pressure may strengthen.
Conversely, when the MACD line crosses below the signal line, bearish pressure starts building. As a result, sellers may dominate price action.
However, crossover signals work best when combined with broader trend context. Without confirmation, false signals may appear during sideways markets.
Why MACD Crossovers Matter in Professional Trading
Momentum often shifts before price trends become obvious. Therefore, crossover signals act as early warnings of potential movement.
In trending environments, aligned crossovers generate stronger follow-through. Meanwhile, in range-bound markets, signals frequently fail.
Because of this, institutional traders use MACD as a confirmation tool rather than a standalone entry system.
How This MACD Crossover Signal Calculator Works
This calculator simplifies crossover detection using three inputs:
• Fast EMA value
• Slow EMA value
• Signal Line value
If Fast EMA − Slow EMA is greater than the Signal Line, the calculator identifies a bullish crossover.
If Fast EMA − Slow EMA is lower than the Signal Line, the calculator detects a bearish crossover.
If values are nearly equal, no clear momentum shift exists.
Although the formula is straightforward, structured interpretation improves trading consistency.
Using MACD for Intraday Trading
Intraday traders rely on momentum bursts. Therefore, identifying crossover timing is essential.
For example, bullish crossovers above the zero line show stronger continuation bias. On the other hand, crossovers below zero may indicate temporary pullbacks.
Thus, zero-line context enhances decision accuracy.
Using MACD for Futures and Options Trading
Futures traders benefit because momentum alignment reduces counter-trend risk. Since leverage magnifies volatility, confirmation becomes critical.
Options traders also use crossovers to select directional bias. Buying calls during bullish crossovers aligned with trend improves probability. Similarly, bearish crossovers support put strategies.
However, proper risk management remains essential.
Common Mistakes Traders Make
Many traders:
Trade every crossover without context
Ignore higher timeframe direction
Overtrade during sideways conditions
Fail to use stop losses
As a result, small mistakes compound into larger losses.
Structured crossover filtering reduces these errors.
Benefits of Using This Calculator
Instant signal clarity
Reduced manual calculation errors
Faster decision-making
Improved discipline
Although indicators do not guarantee success, structured execution improves consistency.
Best Practices
Confirm higher timeframe trend first.
Avoid trading during low volatility compression.
Combine crossover with risk-reward planning.
Always define stop loss levels.
Professional trading focuses on probability, not prediction.
Related Calculators
To strengthen your trading framework, combine this tool with:
Using crossover confirmation together with risk management creates a more institutional trading approach.
For official market data, refer to the National Stock Exchange of India.
Final Note
The MACD Crossover Signal Calculator is designed to simplify momentum shift detection. However, trading success depends on discipline, structured execution, and risk control.
Align with trend.
Confirm momentum.
Manage risk consistently.
Disclaimer: This calculator is for educational purposes only and does not provide investment advice.