Free Opening Range Breakout calculator for Indian traders.
Opening Range Breakout Calculator
Free Stock Trend Finder
Opening Range Breakout Calculator in India
The Opening Range Breakout Calculator helps traders identify potential breakout opportunities using the price range formed during the first minutes of the trading session. In intraday trading, the opening phase often reflects real market sentiment because institutional orders, overnight news, and global cues influence price behavior immediately after the market opens. Therefore, the opening range becomes an important reference zone for the day.
In the Indian stock market, particularly for NSE traders, volatility is usually highest during the early session. As a result, the first range captures genuine demand and supply activity. Instead of trading randomly, traders rely on this structure to plan entries and targets. Moreover, using opening range levels helps reduce emotional decision-making.
How Does the Opening Range Breakout Calculator Work?
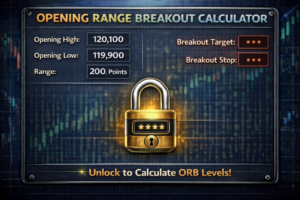
The calculator requires two inputs: opening range high and opening range low. Once these values are entered, the tool measures the difference between them to determine the range. After that, the same range is projected above and below the breakout points. Consequently, traders receive realistic price targets based on actual market movement.
Unlike indicators that rely only on historical averages, this method focuses on current session momentum. Because of this, ORB strategies adapt to daily volatility conditions. Furthermore, they help traders avoid trading during low-momentum periods.
Formula Used
Range = Opening Range High − Opening Range Low
Long Target = High + Range
Short Target = Low − Range
These formulas ensure that targets remain proportional to market volatility.
Example Calculation
Opening High = ₹22,550
Opening Low = ₹22,300
Range = ₹250
Long Breakout Above = ₹22,550
Long Target = ₹22,800
Short Breakout Below = ₹22,300
Short Target = ₹22,050
This example shows how early session range defines potential expansion zones.
Why Opening Range Breakout Strategy Matters
Market behavior shifts during different phases of the day. During the opening phase, price reflects overnight sentiment and institutional positioning. Therefore, breakouts from this range often carry higher probability than random moves. In addition, early session momentum can lead to sustained trends. Consequently, traders prefer ORB for structured entry planning.
This strategy helps traders capture strong trends early. It also helps avoid low-probability trades. Moreover, it provides predefined entry and target levels. As a result, trading becomes more disciplined and less emotional.
Using ORB in Intraday Trading
When price moves above the opening range high with strong volume, bullish momentum may develop. However, traders should not enter blindly. Instead, waiting for confirmation improves trade quality. Moreover, combining ORB with volume and trend direction increases accuracy. As a result, traders avoid false breakouts.
Conversely, when price breaks below the opening range low, bearish pressure may increase. Therefore, traders look for short opportunities only after confirmation. Additionally, stop-loss placement inside the opening range helps manage risk effectively.
Risk Management with ORB
Although ORB strategies can be powerful, risk management remains essential. Traders usually place stop loss inside the opening range because this limits damage if the breakout fails. Furthermore, position sizing should match market volatility. Consequently, traders protect capital while participating in trends.
Common Mistakes Traders Make
Some traders enter before the opening range is formed. Others ignore volume confirmation. In addition, many traders trade during sideways conditions, which reduces ORB effectiveness. Moreover, unrealistic targets often lead to frustration. This calculator helps avoid such mistakes by providing structured levels.
Who Should Use This Calculator?
Intraday traders benefit from ORB strategies because they focus on daily market structure. Scalpers also use these levels for quick breakout trades. Furthermore, futures traders rely on early momentum to capture directional moves. NSE equity traders can apply ORB to understand market tone.
Benefits of This Tool
This tool is simple and fast to use. It is based on real-time price structure rather than complex indicators. Moreover, it works across all markets and timeframes. As a result, traders maintain discipline and clarity.
FAQs
What is Opening Range Breakout?
It is a strategy based on the first session price range.
Is ORB effective in Indian markets?
Yes, NSE traders widely use this method.
Which time frame is best?
Most traders use the first 5 to 30 minutes.
Related Calculators
Disclaimer
This calculator is for educational purposes only and does not provide trading or investment advice.