Free Standard Deviation calculator for Indian traders.
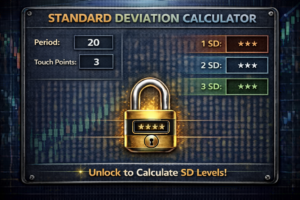
Standard Deviation Calculator
Free Stock Trend Finder
Standard Deviation Calculator in India
The Standard Deviation Calculator helps traders measure how far price moves away from its average level. Many traders focus only on direction, but price behavior is also about variability. When price fluctuates widely, risk increases. When movement is tight, opportunity may shrink. Understanding standard deviation helps traders judge market stability and volatility strength.
In the Indian stock market, standard deviation plays an important role for intraday traders, options traders, and swing traders. Since markets alternate between calm and volatile phases, this calculator simplifies risk measurement using price deviation from the mean.
What is Standard Deviation?
Standard deviation measures how much individual prices differ from the average price. It shows whether price movement is stable or widely spread.
Low Standard Deviation – Price moves close to average
Moderate Standard Deviation – Balanced volatility
High Standard Deviation – Large unpredictable swings
Professional traders use deviation to understand risk, not just direction.
Why Standard Deviation Matters for Indian Traders
Markets in India often shift between quiet sessions and sudden volatility. When deviation is known:
Risk exposure becomes clearer
Position sizing improves
Volatility phases are identified
Stop loss planning becomes structured
Trading without understanding deviation leads to unexpected risk and emotional decisions.
How the Standard Deviation Calculator Works
This calculator uses a set of prices. It calculates:
Mean (average price)
Difference between each price and mean
Squares of differences
Average of those squared values
Square root of variance
This final value is standard deviation.
The larger the value, the more price spreads away from its normal level.
Standard Deviation Trading vs Blind Volatility Trading
Deviation-based trading aligns with mathematical volatility. Blind volatility trading relies on guesswork.
Deviation-based trading offers:
Better risk estimation
Improved stop placement
Clearer volatility zones
Blind trading often leads to overconfidence.
Why This Calculator Is Useful for Intraday Trading
Intraday traders benefit because:
Helps identify expansion days
Signals compression phases
Supports breakout strategies
Prevents oversized positions
Low deviation often precedes big moves. High deviation signals caution.
Using Standard Deviation for Options Traders
Options pricing depends on volatility. Deviation helps:
Understand premium pricing
Identify high-risk phases
Support mean reversion trades
Improve straddle and strangle decisions
Professional options traders closely track volatility deviations.
Using Standard Deviation with Other Indicators
For better accuracy, combine deviation with:
ADR
VWAP
Bollinger Bands
Support and resistance
Deviation measures volatility; structure determines direction.
Common Mistakes Traders Make
Many traders:
Ignore volatility conditions
Trade aggressively in high deviation
Use fixed stops in volatile markets
Overtrade during compression
This calculator prevents such errors.
Who Should Use This Standard Deviation Calculator?
This tool is ideal for:
Intraday traders
Options traders
Swing traders
Risk-focused traders
Volatility traders
Benefits of Measuring Price Deviation
Better risk control
Improved position sizing
Reduced emotional trading
More professional decision making
Higher consistency
Deviation awareness separates amateur traders from professionals.
Best Practices
Use deviation with trend context
Reduce size in high volatility
Watch for compression before breakout
Combine with risk management
Related Calculators
Volatility Percentage Calculator
Standard Deviation Calculator
This tool helps traders measure volatility strength and price variability to improve risk planning and trade structure.
Disclaimer: This Standard Deviation Calculator is for educational purposes only and does not provide trading or investment advice.