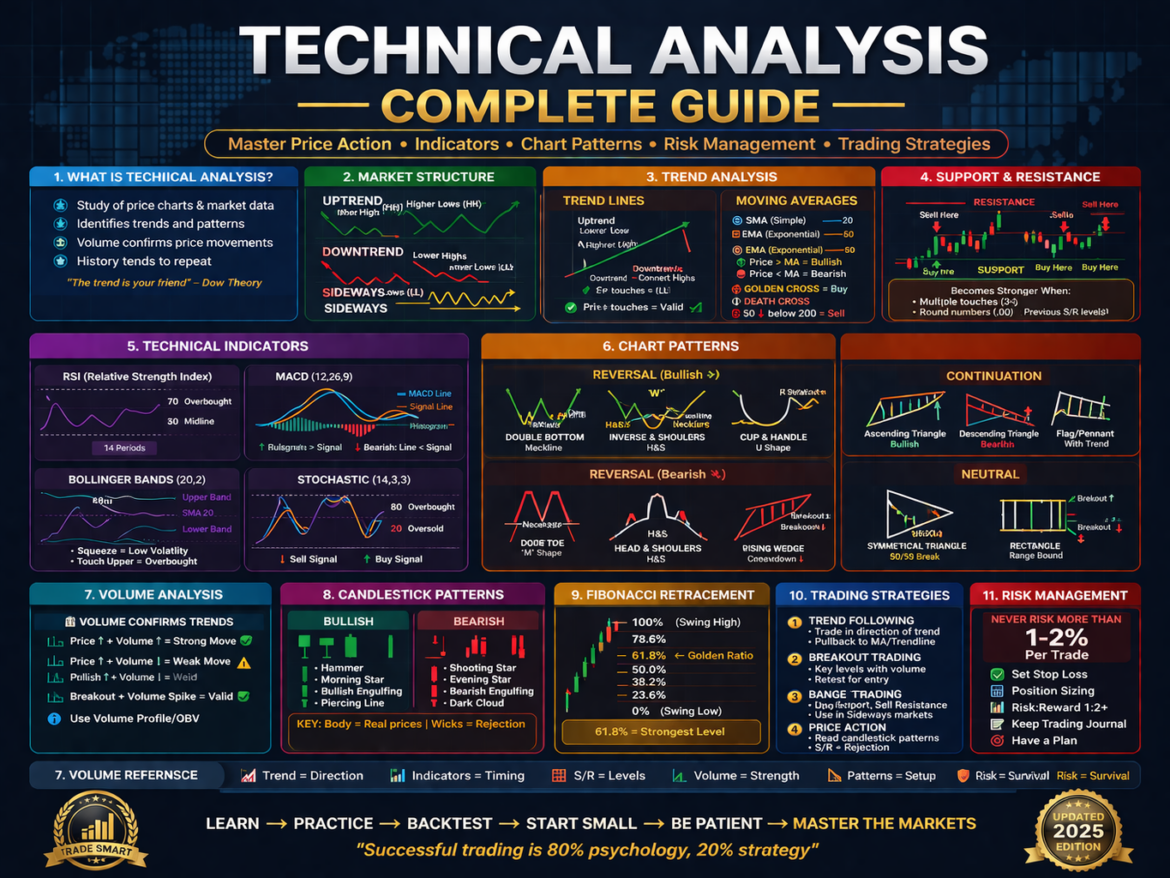
Technical Analysis Complete Guide
Table of Contents
- Introduction to Technical Analysis
- How Technical Analysis Works
- Types of Charts & Candlestick Basics
- Important Candlestick Patterns
- Support & Resistance
- Trend Analysis
- Trendlines & Breakout Trading
- Price Action Basics
- Volume Analysis
- Moving Averages (EMA)
- RSI (Momentum Understanding)
- MACD (Trend & Momentum)
- VWAP (Institutional Price Levels)
- Bollinger Bands (Volatility & Expansion)
- Multi-Timeframe Analysis
- EMA + VWAP Strategy
- Chart Patterns Basic
- Advanced Chart Patterns
- Risk Management & Trading Psychology
- Trading System & Roadmap
Chapter 1: Introduction to Technical Analysis
What is Technical Analysis
Technical Analysis is a method used by traders to study price movement and charts to understand where the market may move next.
In simple terms:
👉 Price tells everything.
This approach focuses on price and volume, because all market information—news, events, and sentiment—is already reflected in price.
Instead of guessing, traders use this method to make structured and logical decisions.
Simple Example to Understand
Suppose a stock is moving between ₹95 and ₹105.
- Near ₹95 → buyers enter
- Near ₹105 → sellers enter
This shows:
- ₹95 = Support
- ₹105 = Resistance
A trader may:
- Buy near ₹95
- Sell near ₹105
👉 This is how chart-based analysis helps avoid random trading.
Technical Analysis vs Fundamental Analysis
There are two main ways to study the market:
Fundamental Analysis
Focuses on company performance like revenue and profit.
Used for long-term investing.
Technical Analysis
Focuses on charts, patterns, and behavior.
Used for short-term trading.
👉 For intraday trading, chart-based study is essential.
Purpose of Technical Analysis
The goal is not to predict perfectly, but to:
- Identify trends
- Find better entry and exit points
- Control risk
- Improve consistency
Professional traders rely on probability, not prediction.
Core Principles
1. Market Discounts Everything
All information is already reflected in price.
2. Price Moves in Trends
Markets follow direction:
- Uptrend
- Downtrend
- Sideways
3. History Repeats Itself
Patterns repeat because trader behavior remains similar.
Why This Method is Important
Using Technical Analysis helps:
- Make better decisions
- Reduce emotional trading
- Improve accuracy
- Manage risk
Without it, trading becomes guesswork.
Common Beginner Mistakes
- Using too many indicators
- Ignoring price behavior
- Entering without confirmation
- No stop loss
Correct Approach
- Keep analysis simple
- Focus on price first
- Follow a system
- Manage risk
👉 Simplicity leads to consistency.
Final Note
Technical Analysis is a skill that improves with time.
With practice, charts become easier to understand, and decision-making becomes more confident.
👉 Focus on consistency, not perfection.
Chapter 2: How Technical Analysis Works
How Technical Analysis Works
Technical Analysis works on one core concept:
👉 Price moves based on demand and supply.
When buyers are stronger, price rises.
When sellers dominate, price falls.
This method helps traders understand:
- Who is in control
- Where price may move
- When to enter or exit
Demand and Supply Basics
Market movement is driven by demand and supply.
Example:
A stock is trading at ₹100.
Suddenly buyers increase.
- Demand rises
- Price moves to ₹105 → ₹110
👉 This movement can be identified through charts.
Market Psychology
Price movement reflects human emotions:
- Greed → pushes price up
- Fear → pushes price down
When traders see price rising:
- More people buy → price increases further
When price falls:
- Panic selling → price drops faster
👉 Charts show this behavior clearly.
Price Action Concept
Price action means analyzing price without depending too much on indicators.
It focuses on:
- Movement
- Structure
- Behavior
Example:
- Higher highs → strength
- Lower lows → weakness
👉 Price action is the foundation of Technical Analysis.
Trend Behavior
Markets move in trends:
Uptrend
Price moves higher
Downtrend
Price moves lower
Sideways
No clear direction
👉 Always trade with the trend for better probability.
Importance of Confirmation
Beginners often enter trades too early.
Instead, wait for confirmation:
- Breakout + strong candle
- Volume support
- Clear pattern
👉 Confirmation increases success rate.
Probability-Based Trading
No method guarantees 100% success.
Even with Technical Analysis:
- Some trades will fail
But with proper strategy:
- Wins > Losses
Example:
- 10 trades → 6 wins, 4 losses
👉 Still profitable
Common Mistakes
- Trading without confirmation
- Ignoring trend
- Overusing indicators
- No risk control
Correct Approach
- Follow price behavior
- Trade with trend
- Wait for confirmation
- Keep strategy simple
Final Thought
Technical Analysis is a logical system, not magic.
Once you understand how it works:
- Charts become clearer
- Decisions improve
- Confidence increases
Chapter 3: Types of Charts & Candlestick Basics
Types of Charts in Trading
When you open any trading platform, the first thing you see is a chart.
Charts are the visual representation of price movement.
There are mainly three types of charts used in trading:
Line Chart
This is the simplest type of chart.
- It connects closing prices with a line
- Easy to understand for beginners
- Shows overall direction
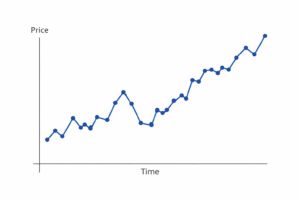
👉 Limitation:
It does not show full price details like highs and lows.
Bar Chart
This chart provides more information than a line chart.
Each bar shows:
- Open price
- High price
- Low price
- Close price
👉 It is more informative, but slightly harder to read for beginners.
Candlestick Chart (Most Important)
This is the most popular chart among traders.
It shows the same data as a bar chart, but in a more visual and easy-to-understand format.
👉 That’s why most traders prefer candlestick charts.
Why Candlestick Charts Are Best
Candlestick charts are powerful because they show:
- Price movement clearly
- Market sentiment
- Strength of buyers and sellers
They help traders quickly understand what is happening in the market.
👉 If you master candlestick charts, you can read the market much better.
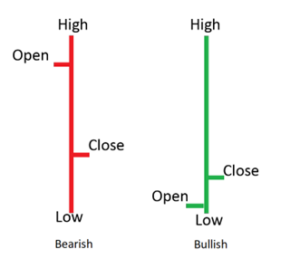
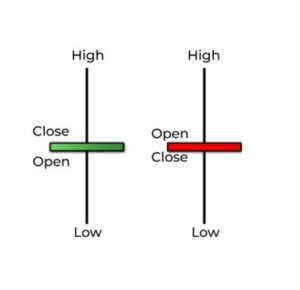
Structure of a Candlestick
Each candlestick represents price movement for a specific time.
It has four main parts:
- Open → Starting price
- High → Highest price
- Low → Lowest price
- Close → Ending price
This is commonly called OHLC.
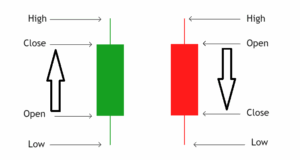
Understanding Candle Body and Wicks
A candlestick has two main parts:
Body
The body shows the difference between open and close.
- Big body → strong movement
- Small body → weak movement
Wicks (Shadows)
The lines above and below the body are called wicks.
- Upper wick → shows rejection from higher price
- Lower wick → shows rejection from lower price
👉 Wicks help understand market pressure.
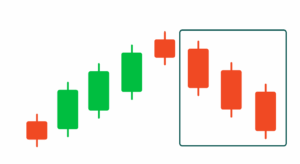
Bullish vs Bearish Candles
Candles are mainly of two types:
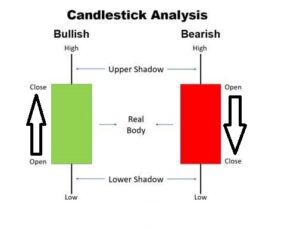
Bullish Candle
- Close > Open
- Usually shown in green
👉 Buyers are in control
👉 Price is moving up
Bearish Candle
- Close < Open
- Usually shown in red
👉 Sellers are in control
👉 Price is moving down
Timeframe in Charts
Each candlestick represents a time period.
Common timeframes:
- 1 minute → very fast (scalping)
- 5 minute → short-term
- 15 minute → best for intraday
- 1 hour → swing trading
👉 Beginners should focus on 15-minute timeframe for better clarity.
How to Read Candlestick Charts
To read charts effectively, focus on:
- Direction of candles
- Size of candles
- Position near support/resistance
- Trend of the market
Example:
If you see:
- Continuous green candles
👉 Strong buying pressure
If you see:
- Long upper wicks
👉 Sellers are rejecting higher prices
Practical Example
Suppose a stock is in an uptrend.
- You see a strong green candle
- With small wick
👉 Buyers are strong
Next candle also moves up
👉 Trend continues
But if suddenly:
- A red candle with long upper wick appears
👉 It shows rejection
👉 This may signal a possible reversal or pullback.
Common Beginner Mistakes
- Ignoring candle size
- Not looking at wicks
- Trading only based on color
- Using too many indicators instead of reading price
Correct Approach
- Focus on candle structure
- Combine with support/resistance
- Understand trend first
- Avoid overcomplicating charts
👉 Clean charts give better clarity.
Key Takeaway
Candlestick charts are the foundation of trading.
If you understand:
- Candle structure
- Buyer vs seller behavior
- Market movement
👉 You can read charts with confidence.
Final Note
Charts may look confusing at first, but with practice, patterns become easier to understand.
👉 Start simple
👉 Observe more
👉 Trade less in the beginning
Chapter 4: Important Candlestick Patterns
What are Candlestick Patterns
Candlestick patterns are specific formations created by one or more candles on a chart.
These patterns help traders understand market behavior and possible next move.
Each pattern shows:
- Buyer strength
- Seller strength
- Market indecision
👉 In simple terms, candlestick patterns help you read what the market is trying to say.
Why Candlestick Patterns are Important
These patterns are important because:
- They give early signals of reversal or continuation
- They help in better entry timing
- They improve decision-making
- They reflect market psychology
👉 But remember:
A pattern is a signal, not a guarantee.
Single Candlestick Patterns
These patterns are formed using only one candle.
Hammer (Bullish Reversal)
Structure:
- Small body
- Long lower wick
- Appears after a downtrend
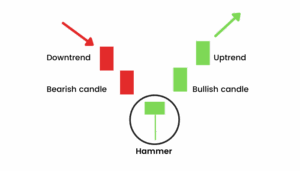
Meaning:
👉 Sellers pushed price down, but buyers came back strongly
Trading idea:
- Buy above the high of the hammer
- Stop loss below the wick
Shooting Star (Bearish Reversal)
Structure:
- Small body
- Long upper wick
- Appears after an uptrend
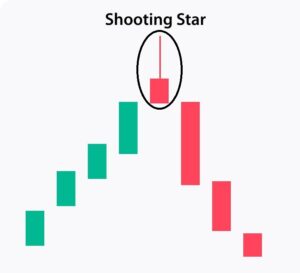
Meaning:
👉 Buyers tried to push price up, but sellers rejected it
Trading idea:
- Sell below the low of the candle
- Stop loss above the wick
Doji (Indecision Candle)
Structure:
- Very small body
- Open and close almost equal
Meaning:
👉 Buyers and sellers are in balance
Trading idea:
- Wait for breakout confirmation
- Do not trade immediately
Marubozu (Strong Momentum Candle)
Structure:
- No wick
- Full body
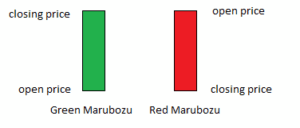
Meaning:
👉 Strong buying (green) or strong selling (red)
Trading idea:
- Trade in the direction of the candle
- Keep small stop loss
Double Candlestick Patterns
These patterns are formed using two candles.
Bullish Engulfing
Structure:
- First candle = red
- Second candle = large green covering the first
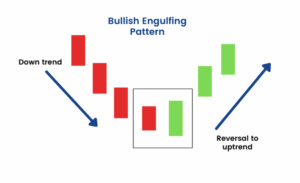
Meaning:
👉 Buyers have taken control
Trading idea:
- Buy above the green candle
- Stop loss below the pattern
Bearish Engulfing
Structure:
- First candle = green
- Second candle = large red covering the first
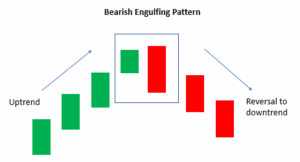
Meaning:
👉 Sellers have taken control
Trading idea:
- Sell below the red candle
- Stop loss above the pattern
Piercing Pattern (Bullish)
Structure:
- Appears after a downtrend
- Green candle closes above midpoint of red
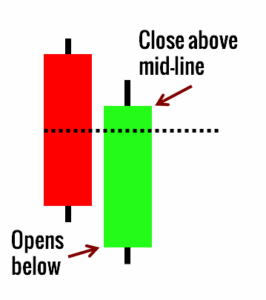
Meaning:
👉 Buyers are gaining strength
Dark Cloud Cover (Bearish)
Structure:
- Appears after an uptrend
- Red candle closes below midpoint of green
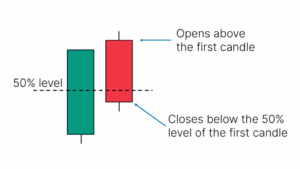
Meaning:
👉 Sellers are gaining control
Triple Candlestick Patterns
These patterns are formed using three candles and are more reliable.
Morning Star (Bullish Reversal)
Structure:
- Red candle → small candle → big green candle
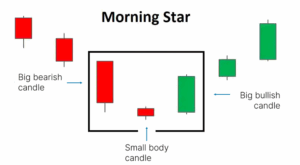
Meaning:
👉 Market is reversing from downtrend to uptrend
Trading idea:
- Buy after confirmation of green candle
Evening Star (Bearish Reversal)
Structure:
- Green candle → small candle → big red candle
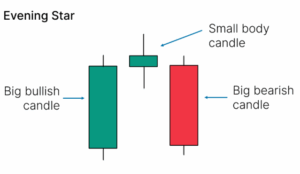
Meaning:
👉 Market is reversing from uptrend to downtrend
Trading idea:
- Sell after confirmation
Three White Soldiers (Bullish)
Structure:
- Three strong green candles
Meaning:
👉 Strong buying momentum
Three Black Crows (Bearish)
Structure:
- Three strong red candles
Meaning:
👉 Strong selling pressure
How to Use Candlestick Patterns
Many beginners make the mistake of trading patterns directly.
👉 Correct way to use them:
- Always check trend first
- Use support and resistance
- Wait for confirmation
- Combine with volume
Example:
If a bullish pattern forms at support → strong signal
If same pattern forms in middle → weak signal
Common Mistakes
- Trading every pattern blindly
- Ignoring trend
- Not using stop loss
- Entering without confirmation
Pro Tips
- Focus on 15-minute timeframe
- Trade only strong patterns
- Combine patterns with levels
- Keep risk-reward at least 1:2
Key Takeaway
Candlestick patterns help you understand:
- Market psychology
- Strength of buyers and sellers
- Possible reversals or continuation
👉 But patterns work best when combined with other concepts.
Final Note
Do not try to memorize all patterns at once.
👉 Start with:
- Hammer
- Engulfing
- Doji
Practice them on charts daily.
Over time, you will naturally recognize patterns.
Chapter 5: Support & Resistance
What is Support
Support is a price level where the market stops falling and starts moving upward.
In simple terms:
👉 Support acts like a floor for price.
At this level, buyers become active and prevent the price from falling further.
What is Resistance
Resistance is a price level where the market stops rising and starts moving downward.
In simple terms:
👉 Resistance acts like a ceiling for price.
At this level, sellers become active and push the price down.
Simple Example
Let’s say a stock is moving between ₹100 and ₹120:
- Near ₹100 → price moves up again → Support
- Near ₹120 → price falls again → Resistance
👉 In this range:
- Traders may look to buy near ₹100
- Traders may look to sell near ₹120
This helps in making structured trading decisions instead of guessing.
Why Support & Resistance Work
These levels work because of:
- Past price reactions
- Buyer and seller behavior
- Institutional activity
When a level has reacted multiple times in the past, traders expect it to react again.
👉 This is why price often respects these levels.
Types of Support & Resistance
Horizontal Levels
These are the most common levels.
Price reacts at the same level multiple times.
Dynamic Levels
These levels change over time.
They are often formed using indicators like moving averages.
Psychological Levels
Round numbers such as:
- ₹100
- ₹500
- ₹1000
👉 Traders naturally react more at these levels.
How to Mark Strong Levels
Marking strong levels is an important skill.
Step-by-step process:
- Open a chart (15-minute timeframe is ideal for beginners)
- Identify areas where price has reversed multiple times
- Draw a line or zone around those areas
Important Rules:
- More touches = stronger level
- Strong moves create important levels
- Avoid cluttering your chart with too many lines
👉 Focus on quality, not quantity.
Support Becomes Resistance (Role Reversal)
This is a very important concept.
- When support breaks → it becomes resistance
- When resistance breaks → it becomes support
Example:
If ₹100 was acting as support and breaks down,
👉 it may act as resistance in the future.
Breakout vs Reversal
Breakout
A breakout happens when price moves strongly beyond a level.
Signs of breakout:
- Strong candle
- High volume
👉 Indicates continuation of trend.
Reversal
A reversal happens when price bounces from a level.
Signs of reversal:
- Rejection wicks
- Weak momentum
👉 Indicates change in direction.
Practical Example
Let’s say a stock has resistance at ₹200:
Case 1:
- Price breaks above ₹200
- Strong bullish candle forms
- Volume increases
👉 Possible breakout → Buying opportunity
Case 2:
- Price reaches ₹200
- Forms a long upper wick
👉 Rejection → Possible selling opportunity
Common Beginner Mistakes
- Drawing too many levels
- Treating levels as exact points instead of zones
- Entering trades without confirmation
- Ignoring volume
Correct Approach
- Treat levels as zones, not exact lines
- Wait for confirmation before entering
- Trade with the trend
- Manage your risk properly
Pro Tips
- Use 15-minute timeframe for clarity
- Focus on liquid stocks
- Observe the same stocks regularly
- Practice improves accuracy
Key Takeaway
Support and resistance are the foundation of chart reading.
They help you:
- Identify better entry points
- Reduce risk
- Improve decision-making
Final Note
This concept may look simple, but it is very powerful.
👉 You do not need many levels — just the right ones.
Practice regularly and observe how price reacts at these levels.
Chapter 6: Trend Analysis
What is a Trend
A trend is the general direction in which the market is moving over a period of time.
In simple terms:
👉 Trend tells you whether the market is going up, down, or sideways.
Understanding trend is one of the most important skills in trading because it helps you trade in the right direction.
Why Trend Analysis is Important
Trend analysis helps traders:
- Identify the direction of the market
- Avoid wrong trades
- Improve accuracy
- Increase probability of success
👉 The most basic rule in trading:
Follow the trend, do not fight it
Types of Trends
There are three main types of trends:
Uptrend (Bullish Market)
An uptrend is when the price is continuously moving higher.
Structure:
- Higher Highs
- Higher Lows
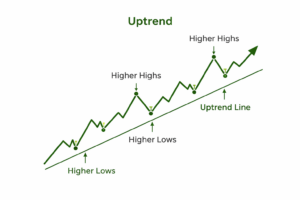
This means:
- Buyers are in control
- Demand is stronger than supply
👉 Best strategy: Look for buying opportunities
Downtrend (Bearish Market)
A downtrend is when the price is continuously moving lower.
Structure:
- Lower Highs
- Lower Lows
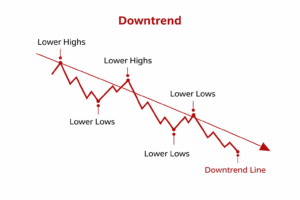
This means:
- Sellers are in control
- Supply is stronger than demand
👉 Best strategy: Look for selling opportunities
Sideways Market (Range-Bound)
In a sideways market, price moves in a range without a clear direction.
Structure:
- No higher highs or lower lows
- Price moves between support and resistance
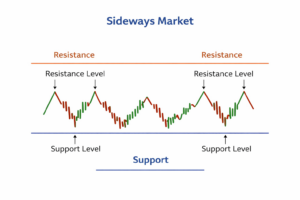
This means:
- Buyers and sellers are equal
- No strong trend
👉 Best strategy: Trade less or wait for breakout
How to Identify a Trend
You can identify trend using simple observation.
Step-by-step:
- Look at recent price movement
- Identify highs and lows
- Check the pattern
Simple Rules:
- Higher highs + higher lows → Uptrend
- Lower highs + lower lows → Downtrend
- Equal highs and lows → Sideways
👉 Keep it simple — no need to overcomplicate.
Trend Strength
Not all trends are equally strong.
Strong Trend:
- Big candles
- Small pullbacks
- Continuous movement
Weak Trend:
- Small candles
- Frequent reversals
- Unclear direction
👉 Always prefer trading in strong trends.
Trend Reversal
A trend does not last forever.
At some point, it changes direction.
Signs of Reversal:
- Break of previous high/low
- Strong opposite candle
- Failure to continue trend
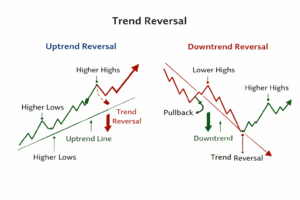
Example:
If an uptrend stops making higher highs,
👉 It may be reversing.
Pullback in Trend
A pullback is a temporary move against the trend.
Example:
In an uptrend:
- Price goes up
- Then comes down slightly
- Then continues upward
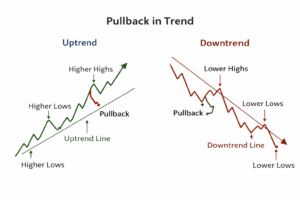
👉 This small drop is called a pullback.
Why Pullbacks are Important
Pullbacks give better entry opportunities.
Instead of buying at the top,
👉 traders wait for pullback to enter at a better price.
Trendline Basics
Trendlines help visualize trend direction.
- In uptrend → draw line below price
- In downtrend → draw line above price
👉 Trendline helps identify support and resistance dynamically.
Common Beginner Mistakes
- Trading against the trend
- Entering trades too late
- Ignoring trend completely
- Overanalyzing charts
Correct Approach
- Identify trend first
- Trade in same direction
- Use pullbacks for entry
- Avoid trading in sideways market
Pro Tips
- Trend is your biggest advantage
- Do not try to catch top or bottom
- Wait for clear structure
- Focus on clean charts
Key Takeaway
Trend analysis is the backbone of trading.
If you understand trend:
- Your decision-making improves
- Your risk reduces
- Your consistency increases
Final Note
Trading becomes much easier when you follow the trend.
👉 Do not try to be right
👉 Try to be in the right direction
Chapter 7: Trendlines & Breakout Trading
What are Trendlines
Trendlines are simple lines drawn on a chart to connect price points and show the direction of the market.
They help traders understand:
- Market direction
- Key support and resistance areas
- Possible entry and exit points
👉 In simple terms:
A trendline is a visual tool that shows how price is moving.
Types of Trendlines
There are two main types of trendlines:
Uptrend Line
In an uptrend, a trendline is drawn by connecting higher lows.
- The line is drawn below the price
- It acts as support
👉 As long as price respects this line, the uptrend remains strong.
Downtrend Line
In a downtrend, a trendline is drawn by connecting lower highs.
- The line is drawn above the price
- It acts as resistance
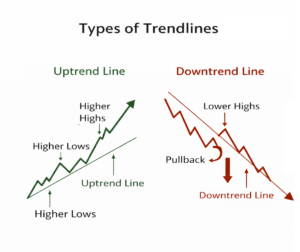
👉 As long as price stays below this line, the downtrend continues.
How to Draw Trendlines Correctly
Drawing trendlines properly is very important.
Step-by-step:
- Open your chart (15-minute timeframe is ideal for beginners)
- Identify clear highs or lows
- Connect at least two points
- Extend the line forward
Important Rules:
- Use clear and visible swing points
- Avoid forcing the line to fit price
- The more touches, the stronger the trendline
👉 A valid trendline usually has 3 or more touches
Role of Trendlines in Trading
Trendlines act as:
- Support in an uptrend
- Resistance in a downtrend
They help traders:
- Find entry points
- Identify trend strength
- Spot potential reversals
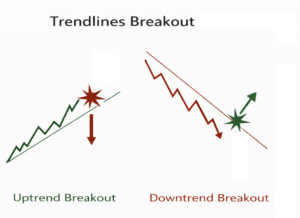
What is a Breakout
A breakout happens when price moves beyond a trendline or key level with strength.
👉 This indicates that the current structure is changing.
Breakouts can lead to:
- Strong upward movement
- Strong downward movement
Types of Breakouts
Bullish Breakout
- Price breaks above resistance or trendline
- Buyers take control
👉 Possible buying opportunity
Bearish Breakout
- Price breaks below support or trendline
- Sellers take control
👉 Possible selling opportunity
How to Trade Breakouts
Many beginners make mistakes in breakout trading.
👉 Correct approach:
Buy Setup (Bullish Breakout)
- Price breaks above resistance
- Strong candle forms
- Volume increases
👉 Enter after confirmation
👉 Stop loss below breakout level
Sell Setup (Bearish Breakout)
- Price breaks below support
- Strong red candle forms
- Volume increases
👉 Enter after confirmation
👉 Stop loss above breakout level
Importance of Retest
After a breakout, price often comes back to test the level again.
This is called a retest.
Example:
- Resistance breaks
- Price comes back to same level
- Then moves upward
👉 This gives a safer entry point.
False Breakouts (Big Trap)
Not all breakouts are real.
Sometimes price:
- Breaks the level
- Then quickly reverses
👉 This is called a false breakout.
Signs of False Breakout:
- Weak candle
- Low volume
- Immediate reversal
👉 Beginners often lose money here.
How to Avoid False Breakouts
- Wait for candle close
- Look for volume confirmation
- Avoid trading in sideways markets
- Use retest strategy
👉 Patience is key.
Practical Example
Let’s say a stock has resistance at ₹150:
Case 1 (Real Breakout):
- Price breaks ₹150
- Strong green candle
- Volume increases
👉 Possible buying opportunity
Case 2 (False Breakout):
- Price crosses ₹150 slightly
- Weak candle
- Falls back quickly
👉 Avoid trade
Common Beginner Mistakes
- Entering before confirmation
- Ignoring volume
- Trading every breakout
- Not using stop loss
Correct Approach
- Wait for clear breakout
- Confirm with volume
- Use retest for safer entry
- Manage risk properly
Pro Tips
- Breakouts work best in trending markets
- Avoid choppy or sideways conditions
- Focus on strong levels
- Trade less, but trade smart
Key Takeaway
Trendlines and breakouts help traders understand:
- Market structure
- Entry timing
- Trend continuation
👉 When used correctly, they can significantly improve accuracy.
Final Note
Do not rush into breakouts.
👉 Wait, observe, and confirm
Good trading is not about speed — it is about timing.
Chapter 8: Price Action Basics
What is Price Action
Price action means studying the movement of price directly from the chart without depending too much on indicators.
In simple terms:
👉 Price action = reading what price is doing
Instead of using multiple tools, traders focus on:
- Price movement
- Candle behavior
- Market structure
👉 This gives a clear and real understanding of the market.
Why Price Action is Important
Price action is considered the foundation of trading because:
- It shows real-time market behavior
- It is faster than indicators
- It gives clean and simple signals
👉 Indicators are based on price, but price itself is the original source.
What is Market Structure
Market structure refers to how price moves over time using highs and lows.
It helps traders understand:
- Trend direction
- Strength of market
- Possible reversals
👉 Market structure is the backbone of price action.
Key Components of Market Structure
To understand structure, you need to focus on:
- Higher High (HH)
- Higher Low (HL)
- Lower High (LH)
- Lower Low (LL)
Uptrend Structure
An uptrend is formed when:
- Price makes Higher Highs (HH)
- Price makes Higher Lows (HL)
👉 This shows buyers are in control.
Downtrend Structure
A downtrend is formed when:
- Price makes Lower Highs (LH)
- Price makes Lower Lows (LL)
👉 This shows sellers are in control.
Sideways Structure
In a sideways market:
- Price does not make clear HH or LL
- It moves in a range
👉 This shows no clear control.
Understanding Swing Highs and Lows
Swing highs and lows are turning points in the market.
Swing High
A point where price stops rising and starts falling.
Swing Low
A point where price stops falling and starts rising.
👉 These points help define market structure.
How to Read Market Structure
Step-by-step:
- Identify recent highs and lows
- Check if highs are increasing or decreasing
- Observe the pattern
Simple Rules:
- HH + HL → Uptrend
- LH + LL → Downtrend
- No clear pattern → Sideways
👉 Keep your analysis simple.
Break of Structure (Important Concept)
A break of structure happens when price breaks its previous pattern.
Example:
In an uptrend:
- Price stops making higher highs
- Breaks previous low
👉 This may signal a trend reversal.
Price Behavior (Market Clues)
Price action gives clues through behavior:
Strong Move
- Large candles
- Small wicks
👉 Strong momentum
Weak Move
- Small candles
- Long wicks
👉 Uncertainty
👉 These signals help you understand market strength.
Clean Chart Concept
Many beginners make charts complicated by adding too many indicators.
👉 Professional traders prefer clean charts.
Focus only on:
- Price
- Levels
- Structure
👉 Clean charts = better clarity
Practical Example
Let’s say:
- Price is making higher highs
- Pullback happens
- Then price moves up again
👉 This confirms an uptrend.
Now suddenly:
- Price breaks the previous low
👉 Structure is broken
👉 Possible trend change
Common Beginner Mistakes
- Ignoring market structure
- Using too many indicators
- Trading without understanding price movement
- Entering trades randomly
Correct Approach
- Focus on highs and lows
- Identify trend first
- Wait for clear structure
- Keep analysis simple
Pro Tips
- Structure is more important than indicators
- Always check recent price behavior
- Combine structure with support/resistance
- Practice regularly on charts
Key Takeaway
Price action helps you understand:
- Who is in control
- Where price may move
- When to enter a trade
👉 It is the most powerful and simple way to read the market.
Final Note
At first, price action may look confusing.
But with practice:
- Patterns become clear
- Structure becomes easy to identify
- Confidence improves
👉 Focus on learning, not rushing.
Chapter 9: Volume Analysis
What is Volume in Trading
Volume refers to the number of shares traded in a stock during a specific period of time.
In simple terms:
👉 Volume shows how much activity is happening in the market
- High volume → many buyers and sellers active
- Low volume → less interest in the stock
Why Volume is Important
Volume helps traders understand the strength behind a price move.
Price alone tells direction, but volume tells conviction.
👉 Example:
- Price going up + high volume → strong move
- Price going up + low volume → weak move
Volume and Price Relationship
Understanding the relationship between price and volume is very important.
Price Up + Volume Up
- Strong buying interest
- Trend likely to continue
👉 Bullish signal
Price Up + Volume Down
- Weak buying
- Move may not sustain
👉 Be cautious
Price Down + Volume Up
- Strong selling pressure
- Downtrend may continue
👉 Bearish signal
Price Down + Volume Down
- Weak selling
- Possible reversal or consolidation
👉 Watch carefully
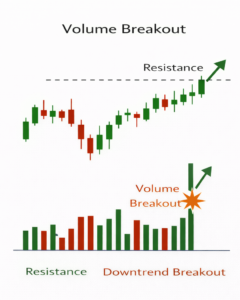
Volume in Breakouts
Volume plays a key role in breakout trading.
Strong Breakout
- Price breaks a level
- Volume increases significantly
👉 Indicates strong participation
👉 Higher probability of success
Weak Breakout
- Price breaks level
- Volume remains low
👉 Risk of false breakout
👉 Always check volume before entering a breakout trade.
Volume and Reversal Signals
Volume can also help identify reversals.
High Volume at Support
- Price falls to support
- Volume spikes
👉 Buyers entering
👉 Possible upward reversal
High Volume at Resistance
- Price reaches resistance
- Volume increases
👉 Sellers active
👉 Possible downward reversal
Volume Spike (Important Concept)
A sudden increase in volume is called a volume spike.
It indicates:
- Strong interest
- Institutional activity
👉 But direction matters:
- Spike with green candle → strong buying
- Spike with red candle → strong selling
Low Volume (Warning Sign)
Low volume means lack of interest.
👉 In low volume conditions:
- Breakouts may fail
- Price may move sideways
- Signals become unreliable
👉 Better to avoid trading in such conditions.
Volume Confirmation Rules
To use volume effectively, follow these rules:
- Always confirm price move with volume
- Avoid trades with weak volume
- Look for increasing volume in trends
- Combine volume with support/resistance
Practical Example
Let’s say a stock is at resistance ₹150:
Case 1 (Strong Move)
- Price breaks ₹150
- Volume increases
👉 Strong breakout → buy opportunity
Case 2 (Weak Move)
- Price crosses ₹150 slightly
- Volume is low
👉 Possible fake breakout → avoid trade
Common Beginner Mistakes
- Ignoring volume completely
- Entering trades without confirmation
- Trading in low volume stocks
- Overcomplicating analysis
Correct Approach
- Use volume as confirmation tool
- Focus on liquid stocks
- Combine volume with price action
- Keep analysis simple
Pro Tips
- High volume = strong move
- Low volume = weak move
- Volume is best used with breakouts
- Watch for volume spikes near key levels
Key Takeaway
Volume helps you understand:
- Strength of price movement
- Market participation
- Validity of breakout or reversal
👉 It acts as a confirmation tool, not a standalone signal.
Final Note
Do not ignore volume.
Even a perfect setup can fail without volume support.
👉 Always ask:
“Is this move backed by strong participation?”
Chapter 10: Moving Averages (EMA)
What is a Moving Average
A moving average is a tool that helps smooth out price data to show the overall direction of the market.
In simple terms:
👉 It shows the average price over a period of time
Instead of looking at random price movement, moving averages help traders see the trend more clearly.
Why Moving Averages are Important
Moving averages are widely used because they:
- Help identify trend direction
- Reduce market noise
- Provide dynamic support and resistance
- Help in timing entries and exits
👉 They make charts easier to understand.
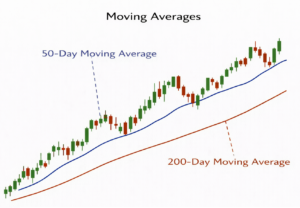
Types of Moving Averages
There are mainly two types:
Simple Moving Average (SMA)
- Calculates average price over a period
- Moves slowly
- Gives smoother signals
👉 Best for long-term analysis
Exponential Moving Average (EMA)
- Gives more weight to recent prices
- Reacts faster to price changes
👉 Best for short-term trading (intraday)
Why EMA is Better for Intraday
EMA is more popular among traders because:
- It reacts quickly
- It captures early trend changes
- It gives faster signals
👉 That’s why EMA is widely used in intraday strategies.
Common EMA Settings
For intraday trading, the most commonly used EMAs are:
- 9 EMA → short-term trend
- 21 EMA → medium-term trend
👉 This combination is simple and effective.
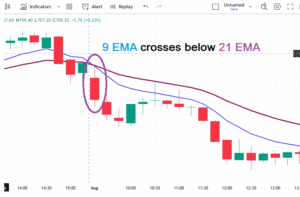
EMA Crossover Strategy
This is one of the most popular strategies.
Buy Setup (Bullish Crossover)
- 9 EMA crosses above 21 EMA
- Price is moving upward
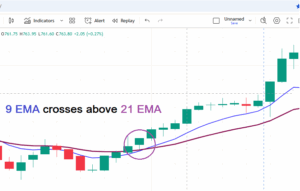
👉 Indicates trend is turning bullish
Entry: After candle closes above crossover
Stop Loss: Below recent swing low
Target: Next resistance or 1:2 risk-reward
Sell Setup (Bearish Crossover)
- 9 EMA crosses below 21 EMA
- Price is moving downward
👉 Indicates trend is turning bearish
Entry: After candle closes below crossover
Stop Loss: Above recent swing high
Target: Next support or 1:2 risk-reward
EMA as Dynamic Support & Resistance
EMA also acts as a moving support or resistance.
In Uptrend
- Price respects EMA and moves upward
👉 EMA acts as support
In Downtrend
- Price respects EMA and moves downward
👉 EMA acts as resistance
How to Use EMA Correctly
To use EMA effectively:
- Combine with trend analysis
- Use with support and resistance
- Confirm with volume
- Avoid using too many EMAs
👉 Keep it simple and clean.
Best Market Conditions for EMA
EMA works best in:
- Trending markets
- Stocks with good volume
- Clear price movement
Avoid Using EMA When:
- Market is sideways
- EMAs are flat
- Price is moving randomly
👉 In such conditions, signals become unreliable.
Practical Example
Let’s say:
- 9 EMA crosses above 21 EMA
- Price is above both lines
- Volume is increasing
👉 This indicates a strong bullish setup
Now another case:
- EMAs are flat
- Price moving sideways
👉 No clear signal → avoid trade
Common Beginner Mistakes
- Entering trade immediately after crossover
- Using EMA in sideways market
- Adding too many indicators
- Ignoring price action
Correct Approach
- Wait for candle confirmation
- Trade in trending market
- Combine with other concepts
- Manage risk properly
Pro Tips
- EMA works best with trend
- Use 9 & 21 combination for simplicity
- Avoid overtrading
- Focus on quality setups
Key Takeaway
Moving averages help you:
- Identify trend
- Filter noise
- Improve entry timing
👉 EMA is one of the simplest and most effective tools for intraday trading.
Final Note
Do not rely only on EMA.
👉 Use it as a support tool, not the main decision-maker
Combine it with price action and levels for better results.
Chapter 11: RSI (Momentum Understanding)
What is RSI
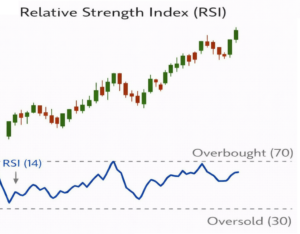
RSI (Relative Strength Index) is a momentum indicator that measures the speed and strength of price movement.
It moves between 0 and 100 and helps traders understand whether the market is:
- Moving too fast upward
- Moving too fast downward
- Or staying neutral
👉 In simple terms:
RSI shows how strong the current move is.
Why RSI is Important
Price shows direction, but RSI shows momentum behind that direction.
This helps traders answer:
- Is the move strong or weak?
- Is the market overextended?
- Is a reversal possible?
👉 RSI adds depth to your analysis.
Understanding RSI Levels
RSI mainly works around three zones:
Above 70 → Overbought Zone
- Market has moved up strongly
- Buying may be exhausted
👉 Possible:
- Pullback
- Short-term reversal
Below 30 → Oversold Zone
- Market has fallen strongly
- Selling may be exhausted
👉 Possible:
- Bounce
- Short-term reversal
Between 40–60 → Neutral Zone
- No strong momentum
- Market is likely sideways
👉 Best to avoid trading here
The Real Meaning of RSI
Most beginners think:
❌ RSI above 70 = Sell
❌ RSI below 30 = Buy
👉 This is a common mistake.
Correct Understanding:
RSI does NOT tell you to buy or sell directly.
It tells you how strong the current move is.
Example:
- RSI above 70 in a strong uptrend
👉 Means strong buying, not immediate reversal - RSI below 30 in a strong downtrend
👉 Means strong selling, not immediate buying
👉 Context matters.
RSI in Trending Markets
RSI behaves differently in trending conditions.
In Strong Uptrend
- RSI often stays between 50–80
- It may not come down to 30
👉 Strategy:
- Look for buying opportunities
- Avoid selling just because RSI is high
In Strong Downtrend
- RSI often stays between 20–50
- It may not reach 70
👉 Strategy:
- Look for selling opportunities
- Avoid buying too early
RSI Reversal Concept
RSI is useful for spotting potential reversals, but only with confirmation.
Bullish Reversal Setup
- RSI goes below 30
- Then moves back above 30
👉 Indicates possible upward move
Bearish Reversal Setup
- RSI goes above 70
- Then falls below 70
👉 Indicates possible downward move
👉 Always confirm with price action before entering.
RSI Divergence (Advanced Concept)
Divergence is one of the most powerful uses of RSI.
Bullish Divergence
- Price makes lower low
- RSI makes higher low
👉 Selling pressure is weakening
👉 Possible upward reversal
Bearish Divergence
- Price makes higher high
- RSI makes lower high
👉 Buying pressure is weakening
👉 Possible downward reversal
👉 Divergence gives early warning, not exact entry.
Combining RSI with Market Structure
RSI becomes more powerful when combined with:
- Support & resistance
- Trend direction
- Price behavior
Example:
- RSI oversold near support
👉 Stronger buying signal - RSI overbought near resistance
👉 Stronger selling signal
👉 Confluence increases probability.
When RSI Fails
RSI is not perfect and can give false signals.
Common failure conditions:
- Strong trending markets
- News-driven moves
- Sideways choppy markets
👉 That’s why RSI should never be used alone.
Practical Thinking Approach
Instead of thinking:
❌ “RSI is 70, I should sell”
Think like this:
✅ “Is the market trending?”
✅ “Is RSI showing strength or weakness?”
✅ “Is there confirmation from price?”
👉 This is how professionals think.
Common Beginner Mistakes
- Using RSI alone
- Selling in strong uptrend
- Buying in strong downtrend
- Ignoring trend direction
Correct Approach
- Use RSI as a supporting tool
- Combine with trend and levels
- Wait for confirmation
- Avoid overtrading
Pro Insights
- RSI is best for understanding momentum
- It works better in range-bound markets
- It becomes powerful with confluence
Key Takeaway
RSI helps you understand:
- Strength of price movement
- Market exhaustion
- Possible reversals
👉 It is not a signal tool, but a decision support tool
Final Note
Do not treat RSI as a shortcut.
👉 Learn to read it with context
👉 Combine it with structure
That’s how you improve accuracy.
Chapter 12: MACD (Trend & Momentum)
What is MACD
MACD (Moving Average Convergence Divergence) is an indicator that helps traders understand both trend direction and momentum strength.
It is built using moving averages, which means it tracks how price is behaving over time.
👉 In simple terms:
MACD shows who is in control and how strong the move is
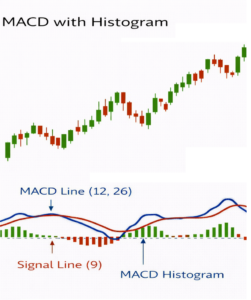
Components of MACD
MACD has three main parts:
1. MACD Line
This line represents the difference between two moving averages.
👉 It reacts to price movement and shows trend direction.
2. Signal Line
This is a smoother line based on the MACD line.
👉 It is used for comparison and confirmation.
3. Histogram
This shows the distance between the MACD line and the signal line.
👉 It helps measure momentum strength.
How MACD Works
MACD works by comparing short-term and long-term price movement.
- When short-term movement becomes stronger → momentum increases
- When it weakens → momentum decreases
👉 This helps identify:
- Trend continuation
- Potential reversals
- Strength of movement
Understanding MACD Signals (The Right Way)
Most beginners focus only on crossovers, but real understanding is deeper.
Bullish Signal
- MACD line crosses above signal line
- Histogram turns positive
👉 Indicates increasing buying momentum
Bearish Signal
- MACD line crosses below signal line
- Histogram turns negative
👉 Indicates increasing selling momentum
👉 But these signals should never be used alone.
The Real Power of MACD
MACD is powerful because it combines:
- Trend (direction)
- Momentum (strength)
👉 Most indicators give only one, but MACD gives both.
Understanding Momentum Through Histogram
The histogram is often ignored by beginners, but it is very important.
Expanding Histogram
- Bars getting bigger
👉 Momentum is increasing
Shrinking Histogram
- Bars getting smaller
👉 Momentum is weakening
👉 This helps you anticipate changes before they happen.
MACD in Trending Markets
MACD works best when the market is trending.
In Uptrend
- MACD stays above zero line
- Pullbacks are shallow
👉 Strategy:
- Focus on buying opportunities
In Downtrend
- MACD stays below zero line
- Weak upward moves
👉 Strategy:
- Focus on selling opportunities
Role of Zero Line
The zero line is very important in MACD.
Above Zero Line
- Market has bullish bias
Below Zero Line
- Market has bearish bias
👉 This helps filter trades and avoid confusion.
Why MACD Crossovers Fail
Many traders lose money using MACD blindly.
Common Reasons:
- Sideways markets
- Late signals
- No confirmation
- Overtrading
👉 MACD is a lagging indicator, so signals come after the move starts.
MACD Divergence (Advanced Concept)
Divergence is one of the most powerful uses of MACD.
Bullish Divergence
- Price makes lower low
- MACD makes higher low
👉 Selling pressure is weakening
👉 Possible upward reversal
Bearish Divergence
- Price makes higher high
- MACD makes lower high
👉 Buying pressure is weakening
👉 Possible downward reversal
👉 Divergence gives early warning, not exact entry.
Combining MACD with Price Action
MACD becomes much stronger when used with:
- Support & resistance
- Trend structure
- Volume
Example:
- MACD bullish crossover near support
👉 Stronger buying signal - MACD bearish crossover near resistance
👉 Stronger selling signal
👉 Always look for confirmation.
Practical Thinking Approach
Instead of thinking:
❌ “MACD crossed, I should trade”
Think like this:
✅ “Is the market trending?”
✅ “Is momentum increasing or decreasing?”
✅ “Is there confirmation from price?”
👉 This mindset improves accuracy.
Common Beginner Mistakes
- Using MACD alone
- Trading every crossover
- Ignoring market condition
- Not understanding momentum
Correct Approach
- Use MACD as a confirmation tool
- Focus on trend first
- Watch histogram behavior
- Avoid sideways markets
Pro Insights
- MACD is powerful in trending markets
- Histogram gives early clues
- Simplicity gives better results
Key Takeaway
MACD helps you understand:
- Trend direction
- Momentum strength
- Possible reversals
👉 It is not a signal tool, but a decision-support tool
Final Note
Do not rely blindly on MACD signals.
👉 Use it with context
👉 Combine it with structure
That’s how professionals use it.
Chapter 13: VWAP (Institutional Price Levels)
What is VWAP
VWAP stands for Volume Weighted Average Price.
It is a line on the chart that shows the average price of a stock based on both price and volume.
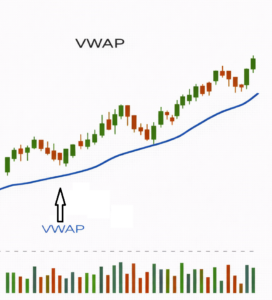
👉 In simple terms:
VWAP shows the fair value of a stock during the day
Why VWAP is Important
VWAP is important because:
- It is widely used by institutions
- It reflects real market value
- It helps identify trend direction
- It acts as dynamic support and resistance
👉 Big players often compare their trades with VWAP.
How VWAP Works
VWAP is calculated using:
- Price
- Volume
This means:
- Higher volume trades have more impact
- Low volume trades have less impact
👉 That’s why VWAP is more reliable than simple averages.
Institutional Perspective (Very Important)
Large institutions like mutual funds and hedge funds use VWAP to:
- Execute large orders
- Avoid moving the market too much
- Get a fair average price
👉 If institutions are buying above VWAP, it shows strength
👉 If they are selling below VWAP, it shows weakness
VWAP as a Trend Indicator
VWAP helps identify market direction clearly.
Price Above VWAP
- Buyers are in control
- Market has bullish bias
👉 Look for buying opportunities
Price Below VWAP
- Sellers are in control
- Market has bearish bias
👉 Look for selling opportunities
👉 This is one of the simplest ways to read intraday trend.
VWAP as Dynamic Support and Resistance
VWAP often acts as a moving level.
In Uptrend
- Price stays above VWAP
- Pullbacks happen near VWAP
👉 VWAP acts as support
In Downtrend
- Price stays below VWAP
- Pullbacks happen near VWAP
👉 VWAP acts as resistance
👉 This behavior is driven by institutional activity.
VWAP Bounce Concept
This is one of the most reliable setups.
Bullish Bounce
- Price above VWAP
- Pullback to VWAP
- Then moves upward
👉 Buyers defending the level
Bearish Bounce
- Price below VWAP
- Pullback to VWAP
- Then moves downward
👉 Sellers defending the level
👉 These setups work well in trending markets.
VWAP Breakout Concept
Sometimes price crosses VWAP with strong momentum.
Bullish Breakout
- Price moves above VWAP
- Strong candle
- Volume increases
👉 Indicates shift in control
Bearish Breakout
- Price moves below VWAP
- Strong selling pressure
👉 Indicates weakness
👉 Always wait for confirmation before entering.
VWAP and Volume Relationship
VWAP becomes more powerful when combined with volume.
Strong Signal
- Price above VWAP
- Volume increasing
👉 Strong buying interest
Weak Signal
- Price near VWAP
- Low volume
👉 Uncertain movement
👉 Volume confirms VWAP signals.
When VWAP Works Best
VWAP gives best results when:
- Market is trending
- Volume is strong
- Price respects the level
When VWAP Fails
VWAP becomes unreliable when:
- Market is sideways
- Price keeps crossing VWAP repeatedly
- No clear direction
👉 Avoid trading in such conditions.
Practical Thinking Approach
Instead of thinking:
❌ “Price touched VWAP, I should trade”
Think like this:
✅ “Is price respecting VWAP?”
✅ “Is there strong volume?”
✅ “Who is in control?”
👉 This is how professionals use VWAP.
Common Beginner Mistakes
- Using VWAP in sideways markets
- Trading without confirmation
- Ignoring volume
- Overtrading near VWAP
Correct Approach
- Use VWAP as a guide, not a signal
- Combine with price structure
- Wait for confirmation
- Focus on trend
Pro Insights
- VWAP reflects institutional behavior
- It is one of the most reliable intraday tools
- Works best with discipline and patience
Key Takeaway
VWAP helps you understand:
- Fair price
- Market direction
- Institutional activity
👉 It is not just an indicator, but a market behavior tool
Final Note
Do not treat VWAP as a shortcut.
👉 Understand its logic
👉 Observe how price reacts around it
That’s where the real edge is.
Chapter 14: Bollinger Bands (Volatility & Expansion)
What are Bollinger Bands
Bollinger Bands are a tool used to measure market volatility and price behavior.
They consist of three lines:
- Middle Band → Average price (moving average)
- Upper Band → Higher boundary
- Lower Band → Lower boundary
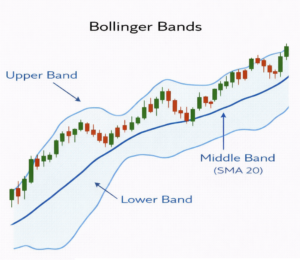
👉 In simple terms:
They show how far price is moving from its average.
Why Bollinger Bands are Important
Markets do not move at a constant speed.
Sometimes they move slowly, and sometimes very fast.
Bollinger Bands help you understand:
- When the market is calm
- When the market is expanding
- When price may reverse or continue
👉 They are mainly used to understand volatility cycles
Understanding Volatility
Volatility means how fast and how much price is moving.
Low Volatility
- Bands are narrow
- Price moves slowly
👉 Market is quiet
High Volatility
- Bands expand
- Price moves strongly
👉 Market is active
👉 Markets move from low volatility to high volatility again and again.
The Concept of Expansion and Contraction
This is the most important concept.
Contraction (Squeeze)
- Bands become tight
- Price movement is small
👉 This indicates that a big move may come soon
Expansion
- Bands widen
- Price starts moving strongly
👉 This shows that the move has started
👉 The best opportunities often come after contraction.
Price Behavior Around Bands
Understanding how price reacts near bands is very important.
Near Upper Band
- Price is stretched upward
- Strong buying or overextension
👉 Possible:
- Continuation (in strong trend)
- Reversal (in weak trend)
Near Lower Band
- Price is stretched downward
- Strong selling or exhaustion
👉 Possible:
- Bounce
- Reversal
👉 Context matters more than position.
Bounce Strategy (Mean Reversion)
This strategy works when the market is not trending strongly.
Bullish Bounce
- Price touches lower band
- Then moves upward
👉 Indicates possible upward move
Bearish Bounce
- Price touches upper band
- Then moves downward
👉 Indicates possible downward move
👉 This works best in sideways markets.
Breakout Strategy (Expansion Move)
This strategy works when the market is trending.
Bullish Breakout
- Price closes above upper band
- Bands start expanding
👉 Indicates strong upward momentum
Bearish Breakout
- Price closes below lower band
- Bands expand
👉 Indicates strong downward momentum
👉 This is the start of a trend, not the end.
Why Most Traders Fail with Bollinger Bands
Many beginners misunderstand this tool.
Common Mistake:
❌ Price touched upper band → Sell
❌ Price touched lower band → Buy
👉 This approach fails in trending markets.
Correct Understanding:
- In strong trends, price can stay near bands for a long time
- Touching a band does not mean reversal
Combining with Market Structure
This tool works best when combined with:
- Trend direction
- Support & resistance
- Price behavior
Example:
- Price at support + lower band touch
👉 Stronger buying signal - Price at resistance + upper band touch
👉 Stronger selling signal
👉 Confluence increases accuracy.
When Bollinger Bands Work Best
They work best in:
- Volatility cycles
- Range-bound markets (bounce)
- Breakout situations (expansion)
When to Avoid Using It
Avoid when:
- Market is highly random
- No clear structure
- You are forcing trades
Practical Thinking Approach
Instead of thinking:
❌ “Price touched band, I should trade”
Think like this:
✅ “Is the market trending or ranging?”
✅ “Are bands expanding or contracting?”
✅ “Is there confirmation from price?”
👉 This mindset improves results.
Common Beginner Mistakes
- Trading every band touch
- Ignoring trend
- Not understanding volatility
- Using it alone
Correct Approach
- Understand market condition first
- Use bands as a guide
- Combine with structure
- Wait for confirmation
Pro Insights
- Markets move in cycles (quiet → explosive)
- Bollinger Bands help detect these cycles
- The squeeze is often the most powerful signal
Key Takeaway
Bollinger Bands help you understand:
- Market volatility
- Expansion and contraction
- Potential breakouts and reversals
👉 It is a volatility tool, not a direct signal tool
Final Note
Do not use Bollinger Bands blindly.
👉 Understand the context
👉 Observe price behavior
That’s where the real edge lies.
Chapter 15: Multi-Timeframe Analysis
What is Multi-Timeframe Analysis
Multi-timeframe analysis means studying the same stock on different timeframes to get a better understanding of the market.
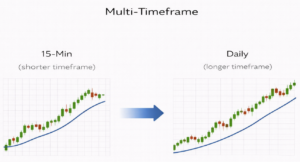
In simple terms:
👉 Big picture + small picture together
Instead of relying on just one chart, traders analyze:
- Higher timeframe (overall direction)
- Lower timeframe (entry timing)
Why Multi-Timeframe Analysis is Important
Many beginners trade only on one timeframe, which leads to confusion.
This approach helps you:
- Avoid wrong trades
- Understand bigger trend
- Improve entry accuracy
- Reduce risk
👉 It brings clarity and confidence.
Understanding Timeframes
Different timeframes show different perspectives.
Higher Timeframe (HTF)
Examples:
- Daily
- 1 Hour
👉 Shows:
- Overall trend
- Major levels
Lower Timeframe (LTF)
Examples:
- 15 min
- 5 min
👉 Shows:
- Entry points
- Short-term moves
👉 Both are important together.
The Big Picture Concept
Professional traders always start with the bigger picture.
Step 1: Check Higher Timeframe
- Identify trend
- Mark key levels
👉 This gives direction
Step 2: Move to Lower Timeframe
- Look for entry
- Wait for confirmation
👉 This gives timing
Example to Understand
Let’s say:
- On daily chart → market is in uptrend
- On 15-min chart → price pulls back
👉 Smart trader will:
- Wait for buying opportunity
- Not sell against trend
👉 This is how multi-timeframe thinking works.
Alignment Concept (Very Important)
Best trades happen when:
- Higher timeframe trend = bullish
- Lower timeframe setup = buy
👉 This is called timeframe alignment
Example:
- Daily → uptrend
- 15-min → breakout
👉 Strong buying setup
When Timeframes Conflict
Sometimes charts give opposite signals.
Example:
- Daily → uptrend
- 15-min → downtrend
👉 This creates confusion.
What to Do:
- Follow higher timeframe
- Wait for alignment
👉 Avoid forced trades.
Entry Timing Using Lower Timeframe
Lower timeframe helps you:
- Enter at better price
- Reduce stop loss
- Improve risk-reward
👉 Without this, entries become random.
Common Beginner Mistakes
- Trading only on one timeframe
- Ignoring higher timeframe trend
- Entering trades too early
- Overtrading
Correct Approach
- Start with higher timeframe
- Confirm with lower timeframe
- Trade with alignment
- Keep analysis simple
Pro Insights
- Big players focus on higher timeframe
- Retail traders focus on lower timeframe
- Smart traders combine both
Key Takeaway
Multi-timeframe analysis helps you:
- Understand market direction
- Improve entry timing
- Trade with confidence
👉 It turns random trading into structured trading.
Final Note
Do not rush between timeframes.
👉 Use them step by step
👉 Build a clear view of the market
Chapter 16: EMA + VWAP Strategy
Why Combine Indicators
Many traders use indicators separately, which often creates confusion and conflicting signals.
A better approach is to combine tools that serve different purposes:
- One to identify trend
- One to identify value or key level
This combination creates clarity and improves decision-making.
Role of EMA in This Strategy
EMA helps identify the direction of the market.
Instead of reacting to every small movement, it gives a smoother view of price behavior.
- When the market stays above EMA, it reflects bullish strength
- When it trades below EMA, it indicates selling pressure
Because of this, EMA acts as a trend filter.
Role of VWAP in This Strategy
VWAP represents the average price based on both price and volume during the trading session.
It highlights where most trading activity has taken place.
- When the market stays above VWAP, buyers are active
- When it remains below VWAP, sellers dominate
Due to this behavior, VWAP works as a decision zone.
Why EMA + VWAP Combination Works
This combination is powerful because it merges two important aspects:
- Direction (EMA)
- Value (VWAP)
While EMA shows where the market is heading, VWAP shows whether the current price is favorable.
Together, they create a structured view of the market.
Core Logic of the Strategy
The idea behind this setup is simple:
- Trade in the direction of the trend
- Enter near a meaningful level
When both tools align, the probability of success improves significantly.
Buy Setup (Bullish Scenario)
Conditions:
- The market is trading above EMA
- It is also holding above VWAP
- A pullback forms toward EMA or VWAP
- Strong bullish candles appear after the pullback
Entry is taken only after confirmation from price movement.
Stop loss should be placed below the recent swing low, while the target can be set near the next resistance or based on risk-reward.
Sell Setup (Bearish Scenario)
Conditions:
- The market is trading below EMA
- It continues to stay below VWAP
- A pullback occurs toward these levels
- Rejection appears through bearish candles
Once confirmation is visible, a short position can be considered.
Stop loss is placed above the recent swing high, and targets are set near support levels.
Importance of Pullback
Chasing the market often leads to poor entries.
A better approach is to wait for a pullback.
- It provides a better entry price
- It reduces risk
- It improves reward potential
Because of this, patience plays a key role in this strategy.
What This Strategy Helps Avoid
This approach naturally filters out weak setups.
It helps avoid:
- Trading against the trend
- Entering random trades
- Acting in unclear market conditions
As a result, fewer but higher-quality trades are taken.
When This Strategy Works Best
This setup performs well when:
- The market shows a clear trend
- Price respects both EMA and VWAP
- Volume supports the movement
In such conditions, continuation moves are more reliable.
When to Avoid This Strategy
Certain conditions reduce the effectiveness of this approach.
It is better to avoid trading when:
- The market is sideways
- Price keeps crossing VWAP repeatedly
- EMA appears flat
Under these conditions, signals become unreliable.
Practical Thinking Approach
Instead of reacting quickly, a better thought process is:
- Is the trend clearly defined?
- Is the price near a meaningful level?
- Is there confirmation from price behavior?
This structured thinking improves consistency.
Common Beginner Mistakes
Many traders struggle because of:
- Entering trades without confirmation
- Ignoring overall market conditions
- Overtrading
- Relying too much on indicators
Avoiding these mistakes can improve results significantly.
Correct Approach
A disciplined method includes:
- Using EMA to understand direction
- Using VWAP to identify entry zones
- Waiting for confirmation
- Managing risk properly
This creates a balanced and controlled trading approach.
Pro Insights
Experienced traders focus on:
- Simplicity over complexity
- Quality over quantity
- Structure over randomness
Combining indicators with logic makes the approach more reliable.
Key Takeaway
This combination helps traders:
- Stay aligned with the trend
- Enter at better levels
- Avoid unnecessary trades
It is not just a strategy, but a structured way of thinking.
Final Note
Indicators should support your decision, not control it.
Understanding the logic behind them is more important than following signals blindly.
With practice and discipline, this approach can become a reliable part of your trading system.
Chapter 17: Chart Patterns Basic
What are Chart Patterns
Chart patterns are formations created by price movement over time.
These patterns help traders understand:
- Market direction
- Possible reversals
- Continuation of trends
👉 In simple terms:
Chart patterns show how buyers and sellers are behaving.
Why Chart Patterns Work
Patterns work because market behavior repeats.
- Traders react to similar price levels
- Emotions like fear and greed repeat
- Institutions create similar structures
👉 This makes patterns reliable when used correctly.
1.Head and Shoulders Pattern
What is Head and Shoulders
Head and Shoulders is a reversal pattern that appears at the top of an uptrend.
It indicates that the trend may change from bullish to bearish.
Structure of the Pattern
It has three parts:
- Left Shoulder → first peak
- Head → higher peak
- Right Shoulder → lower peak
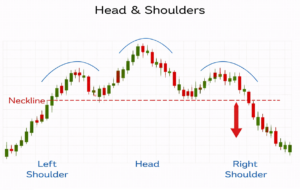
A support line is drawn below these peaks, called the neckline.
What It Represents
- Buyers push price higher (left shoulder)
- Strong push creates the head
- Buyers lose strength (right shoulder)
👉 Sellers slowly take control
How to Trade It
- Wait for price to break the neckline
- Enter after confirmation
- Place stop loss above the right shoulder
👉 This confirms a possible downtrend.
Inverse Head and Shoulders
This is the opposite pattern.
- Appears at bottom
- Indicates bullish reversal
👉 Same logic, but reversed direction.
2.Triangle Patterns
Triangle patterns form when price starts compressing.
They show that the market is preparing for a breakout.
Types of Triangle Patterns
Ascending Triangle (Bullish)
Structure:
- Flat resistance
- Rising support
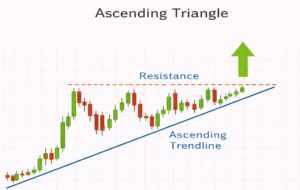
👉 Buyers are becoming stronger
How to Trade
- Wait for breakout above resistance
- Enter after strong candle
- Use stop loss below support
Descending Triangle (Bearish)
Structure:
- Flat support
- Falling resistance
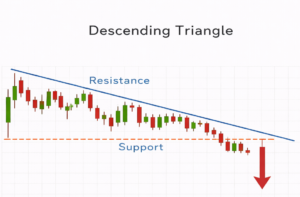
👉 Sellers are becoming stronger
How to Trade
- Wait for breakdown below support
- Enter after confirmation
- Stop loss above resistance
Symmetrical Triangle (Neutral)
Structure:
- Converging trendlines
- No clear direction
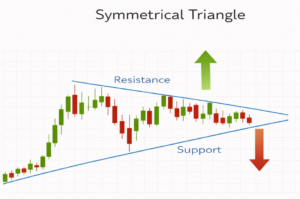
👉 Market is compressing
How to Trade
- Wait for breakout (either side)
- Follow direction of breakout
- Confirm with volume
Why Triangle Patterns Work
As price compresses:
- Volatility decreases
- Pressure builds
👉 Eventually, price breaks strongly in one direction
Breakout Confirmation (Important)
Do not trade immediately.
Wait for:
- Strong candle
- Volume increase
- Clear breakout
👉 This reduces false signals.
Common Beginner Mistakes
- Entering before breakout
- Ignoring volume
- Trading inside triangle
- No confirmation
Correct Approach
- Wait for structure to complete
- Trade only after breakout
- Use proper stop loss
- Follow trend direction
Pro Insights
- Head & Shoulders = reversal signal
- Triangle = breakout preparation
- Patterns work best with confirmation
Key Takeaway
Chart patterns help you:
- Understand market structure
- Predict possible moves
- Improve entry timing
👉 They are powerful when combined with other concepts.
Final Note
Do not try to memorize all patterns.
👉 Focus on:
- Structure
- Behavior
- Confirmation
That’s what makes patterns effective.
Chapter 18: Advanced Chart Patterns
Why Advanced Patterns Matter
Basic patterns are widely used by beginners, but advanced patterns provide an edge that separates professional traders from the rest.
These patterns are important because they:
- Reveal deeper market behavior
- Highlight smart money activity
- Help identify traps and high-probability setups
👉 In simple terms:
Advanced patterns help you understand what the majority of traders miss.
Pattern 1: Cup and Handle
What is Cup and Handle
The Cup and Handle is a bullish continuation pattern that usually forms during an uptrend.
It consists of:
- A rounded bottom (cup)
- A small pullback (handle)
- Followed by a breakout
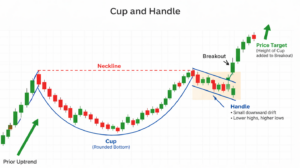
Market Psychology Behind It
- Price declines and forms a rounded base → weak hands exit
- Gradual recovery shows accumulation
- The handle creates a small pullback → final shakeout
- Breakout happens when buyers take full control
👉 This pattern often reflects quiet accumulation by institutions.
How to Trade It
- Wait for price to break above the handle
- Enter after a strong bullish candle
- Place stop loss below the handle
Key Insight
- A smooth, rounded cup indicates strength
- A sharp V-shaped recovery is less reliable
Pattern 2: Falling Wedge
What is Falling Wedge
The Falling Wedge is a bullish reversal pattern that forms during a downtrend.
Structure:
- Price moves downward
- Range starts narrowing
- Trendlines converge
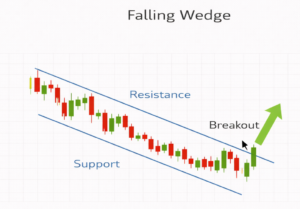
Market Psychology Behind It
- Sellers push the price lower
- Downward momentum gradually weakens
- Price compresses within a narrowing range
- Buyers prepare for a breakout
👉 This indicates that selling pressure is losing strength.
How to Trade It
- Wait for breakout above the upper trendline
- Enter after confirmation
- Place stop loss below the recent low
Key Insight
- Even though price makes lower lows, the strength behind the move is decreasing
- This creates a hidden reversal opportunity
Pattern 3: Liquidity Sweep
What is Liquidity Sweep
A Liquidity Sweep is not a traditional pattern, but a smart money concept.
It happens when price:
- Breaks an important level (support or resistance)
- Triggers retail traders’ entries and stop losses
- Quickly reverses direction
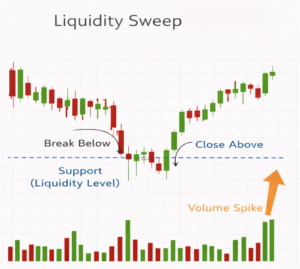
Market Psychology Behind It
- Retail traders enter on breakout
- Large players take opposite positions
- Stop losses get triggered
- Price reverses sharply
👉 This process is often called “stop hunting.”
How to Identify It
Look for:
- Sudden breakout above resistance or below support
- Long wick formation
- Quick reversal after breakout
How to Trade It
- Identify the fake breakout
- Wait for reversal confirmation
- Enter in the opposite direction
- Place stop loss beyond the wick
Key Insight
- This pattern traps beginners
- Experienced traders use it to their advantage
Why These Patterns Are Powerful
These advanced patterns provide:
- Deeper understanding of market behavior
- Insight into institutional activity
- High-probability trading opportunities
👉 They are less common, which makes them more valuable.
Common Mistakes
- Entering before the pattern is complete
- Ignoring confirmation
- Forcing patterns on charts
- Overtrading
Correct Approach
- Wait for proper structure
- Confirm before entering
- Use proper risk management
- Stay patient
Pro Insights
- Markets often move to trap retail traders
- Patterns reflect human emotions
- Understanding behavior is more important than memorizing shapes
Key Takeaway
Advanced patterns help you:
- Identify traps in the market
- Trade with better timing
- Improve overall accuracy
👉 They create a real difference between beginner and professional traders.
Final Note
These setups require practice and observation.
👉 Study charts regularly
👉 Focus on behavior, not just patterns
👉 Build confidence step by step
Chapter 19: Risk Management & Trading Psychology
Why Risk Management is Important in Technical Analysis
Technical Analysis helps you find entries, but risk management helps you stay in the game.
Without proper risk control, even the best Technical Analysis cannot make you profitable.
👉 In simple terms:
Technical Analysis finds opportunities, but risk management protects your capital.
The Role of Risk in Trading
Every trade carries risk.
Even with strong Technical Analysis:
- Some trades will fail
- Some setups will not work
👉 That is why managing loss is more important than chasing profit.
The 1–2% Risk Rule
Professional traders follow a simple rule:
- Risk only 1–2% of total capital per trade
Example:
- Capital = ₹10,000
- Risk per trade = ₹100–₹200
👉 This ensures survival even after multiple losses.
Risk-Reward Ratio
Technical Analysis becomes powerful when combined with proper risk-reward.
👉 Ideal ratio:
- Risk 1 → Reward 2
This means:
- Lose small
- Win bigger
Stop Loss (Most Important Tool)
A stop loss defines how much you are willing to lose.
Even the best Technical Analysis setup can fail, so:
👉 Always use stop loss
👉 Never trade without it
Position Sizing
Position sizing decides how much quantity you should trade.
It depends on:
- Your capital
- Your risk per trade
👉 Good Technical Analysis without proper sizing can still lead to loss.
Trading Psychology (Real Game)
Most traders fail not because of lack of knowledge, but because of poor psychology.
Even if you know Technical Analysis:
- Fear can stop you from entering
- Greed can make you overtrade
- Ego can make you hold losses
Emotional Traps
Common emotional mistakes:
- Revenge trading
- Overtrading
- Fear of missing out (FOMO)
- Holding losing trades
👉 These destroy your account faster than bad analysis.
Discipline Over Strategy
Technical Analysis gives you a system, but discipline makes it work.
👉 Without discipline:
- Rules break
- Losses increase
Consistency Mindset
Success in trading is not about big profits.
It is about:
- Small consistent gains
- Controlled losses
- Following your plan
👉 This is where Technical Analysis and discipline work together.
Common Beginner Mistakes
- Ignoring risk management
- Trading without stop loss
- Overconfidence after wins
- Panic after losses
Correct Approach
- Protect capital first
- Follow rules strictly
- Trust your system
- Focus on long-term growth
Key Takeaway
Technical Analysis alone is not enough.
👉 Profit = Technical Analysis + Risk Management + Psychology
Final Note
You don’t need to win every trade.
👉 You need to manage your losses and stay consistent.
That’s how professionals grow.
Chapter 20: Trading System & Roadmap
Why You Need a System in Technical Analysis
Many traders learn Technical Analysis but fail because they don’t have a system.
👉 A system gives:
- Structure
- Discipline
- Consistency
Without a system, Technical Analysis becomes random.
What is a Trading System
A trading system is a set of rules based on Technical Analysis that defines:
- Entry
- Exit
- Stop loss
- Risk
👉 It removes confusion and emotional decisions.
Building Your Own System
To build a system using Technical Analysis:
Step 1: Choose a Strategy
Focus on one setup only.
Step 2: Define Entry Rules
When will you enter?
Step 3: Define Exit Rules
Where will you book profit?
Step 4: Define Risk
How much will you lose per trade?
👉 This creates clarity.
Backtesting (Important Step)
Before using any system:
- Test it on past charts
- Check performance
- Improve rules
👉 This builds confidence in your Technical Analysis system.
Trading Journal
A journal helps track your performance.
Record:
- Entry
- Exit
- Reason for trade
- Outcome
👉 This improves your Technical Analysis skills over time.
Daily Trading Routine
Professional traders follow a routine:
- Analyze market
- Mark levels
- Plan trades
- Execute with discipline
👉 Routine creates consistency.
Common Mistakes
- Jumping between strategies
- No clear rules
- Ignoring past mistakes
- Overtrading
Correct Approach
- Stick to one system
- Follow rules strictly
- Improve gradually
- Stay patient
Roadmap to Consistency
Step-by-step growth:
- Learn Technical Analysis basics
- Practice on charts
- Build a simple system
- Manage risk
- Stay disciplined
Final Key Insight
Technical Analysis is a tool.
👉 A system turns it into a profession.
Final Note
Success in trading comes from:
- Discipline
- Consistency
- Proper system
👉 Not from shortcuts.
📘 Conclusion: Your Journey with Technical Analysis
Technical Analysis is not just a method — it is a complete skill that develops over time.
Throughout this guide, you have learned how Technical Analysis helps in understanding price movement, market behavior, and trading decisions. From basic concepts to advanced patterns, the goal was to build a strong foundation.
However, success does not come from knowledge alone.
👉 Consistent results come from:
- Practicing Technical Analysis regularly
- Following a structured approach
- Managing risk effectively
- Controlling emotions
Many traders learn Technical Analysis but fail because they do not apply it with discipline. The real edge comes when you combine knowledge with patience and consistency.
It is important to remember that Technical Analysis does not guarantee profit. It only improves probability. Losses are part of the journey, and learning from them is what builds long-term success.
👉 Focus on:
- Process over profit
- Consistency over perfection
- Learning over shortcuts
If you stay committed and keep improving your understanding of Technical Analysis, you can gradually develop confidence and control in your trading decisions.
📘 FAQ: Technical Analysis Guide
1.What is Technical Analysis in simple words?
Technical Analysis is a method of studying price charts to understand market direction and make better trading decisions based on patterns, trends, and behavior.
2.Is Technical Analysis useful for beginners?
Yes, Technical Analysis is beginner-friendly when learned step by step. It helps new traders understand price movement, trends, and entry timing.
3.Is Technical Analysis useful for beginners?
Yes, Technical Analysis is beginner-friendly when learned step by step. It helps new traders understand price movement, trends, and entry timing.
4.What is the biggest mistake in Technical Analysis?
The biggest mistake is overcomplicating charts with too many indicators and ignoring price behavior and risk management.
5.How to become consistent using Technical Analysis?
Consistency comes from following a system, managing risk, controlling emotions, and practicing regularly.
⚠️ Disclaimer
The information provided in this guide is for educational purposes only and should not be considered financial or investment advice.
Technical Analysis is a tool used to understand market behavior, but it does not guarantee any fixed results. Market conditions can change at any time, and losses are always possible.
Before making any trading or investment decision, you should:
- Do your own research
- Understand the risks involved
- Use proper risk management
This guide is designed to help you learn Technical Analysis, not to provide specific buy or sell recommendations.
For official guidelines, investor protection rules, and regulatory information, you can refer to
👉 Securities and Exchange Board of India