Free Triangle Pattern Calculator to detect ascending, descending, and symmetrical triangle breakouts.
Triangle Pattern Calculator
Free BSE Trend Finder
Free Triangle Pattern Calculator in India
The Triangle Pattern Calculator helps traders identify breakout and breakdown opportunities from price compression structures. Triangle patterns form when price consolidates between converging trendlines. Therefore, volatility contracts before expansion.
Many traders struggle to recognize valid triangle breakouts. However, using structured trendline validation reduces false signals. Instead of guessing momentum, traders can monitor compression and wait for confirmation.
What Is a Triangle Pattern?
A triangle pattern is a consolidation structure where price moves within narrowing boundaries. As a result, energy builds before eventual breakout.
There are three main types:
Ascending Triangle
Descending Triangle
Symmetrical Triangle
Although their structures differ slightly, all represent volatility compression.
Why Triangle Patterns Work
Financial markets move in cycles. First, price trends strongly. Then, it consolidates. Finally, expansion resumes.
Triangle patterns represent that consolidation phase. Consequently, breakout direction often determines next major move.
Because traders place stop orders near trendlines, breakout events frequently trigger volatility expansion.
Types of Triangle Patterns Explained
Ascending Triangl
Upper resistance remains flat while higher lows form. Therefore, bullish pressure builds gradually. When resistance breaks, upward momentum may accelerate.
Descending Triangle
Lower support remains flat while lower highs develop. As a result, bearish pressure increases. Breakdown below support often triggers selling momentum.
Symmetrical Triangle
Both trendlines converge symmetrically. Consequently, breakout direction depends on dominant momentum.
How This Triangle Pattern Calculator Works
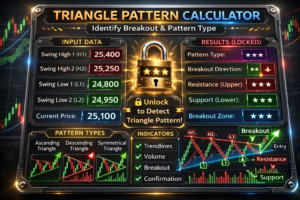
The calculator requires:
Upper trendline value
Lower trendline value
Current price
If price moves above upper boundary, bullish breakout occurs.
If price drops below lower boundary, bearish breakdown forms.
If price remains between lines, consolidation continues.
Although simple, structured confirmation improves discipline.
Triangle Patterns in Indian Markets
In indices like Nifty and Bank Nifty, triangle formations frequently appear before major intraday moves. Since volatility compresses before expansion, breakout timing becomes critical.
Moreover, triangle breakouts during high-volume sessions often lead to strong follow-through.
Therefore, traders should combine pattern analysis with volume confirmation.
Breakout Confirmation Strategy
First, wait for candle close beyond trendline.
Next, confirm volume expansion.
Then, align breakout direction with higher timeframe trend.
Finally, define stop loss inside previous consolidation range.
Because discipline reduces emotional entries, structured execution improves consistency.
Common Mistakes Traders Make
Entering before confirmation
Ignoring overall trend direction
Trading every small consolidation
Overleveraging during volatility spikes
As a result, losses increase unnecessarily.
Professional traders focus on high-probability setups.
Benefits of Using Triangle Pattern Calculator
Clear breakout identification
Reduced subjective analysis
Structured entry planning
Improved risk placement
Although no pattern guarantees profits, disciplined execution enhances performance.
Best Practices
Confirm breakout with volume.
Avoid trading inside narrow compression.
Use risk-reward ratio planning.
Maintain consistent position sizing.
Professional trading depends on structured execution.
Related Calculators
The Breakout Confirmation Calculator helps validate whether triangle breakouts show strong momentum and follow-through potential.
Disclaimer
This Triangle Pattern Calculator is for educational purposes only and does not provide trading or investment advice.